Build a Market Research Report Template That Drives Decisions
Stop creating data dumps. Learn to build a modern market research report template with a clear, slide-by-slide structure for stakeholder-ready insights.
A good market research report template isn't just about plugging in numbers. It's about building a story. The real goal is to take a mountain of raw data and transform it into a sharp, compelling narrative that actually gets people to do something.
The best ones are always slide-ready, built around visuals, and designed to lead your audience straight to a clear, unavoidable conclusion. They steer you away from the classic mistake: creating a dense, unreadable data dump.
Why Your Current Report Template Fails to Make an Impact
Let’s be honest for a second. Most market research reports are dead on arrival. They land in an inbox as a massive, text-heavy document, crammed with charts that don't connect.
Stakeholders are forced to scroll endlessly, trying to piece the puzzle together themselves. It almost always ends with them asking, "Okay... so what are we supposed to do with this?" This isn't a data problem; it's a format problem.
The Disconnect Between Data and Decisions
The core issue is that old-school reports don't connect the dots for the reader. They present information in isolated chunks, making it impossible to see the bigger picture.
I've seen it a hundred times:
- Data in Silos: You’ll find market size on slide 5, a competitor deep-dive on slide 12, and customer survey results buried on slide 20. This disjointed approach kills any chance of holistic understanding.
- Lack of Narrative Flow: Without a story, the report just feels like a collection of random facts. There’s no build-up, no "aha!" moment, and certainly no powerful conclusion.
- Overwhelming Detail: The temptation is to include every single data point to prove you did the work. In reality, you're just burying the critical insights under a pile of noise.
The success of a report isn't measured by its page count or the number of charts. It's measured by whether it gives your audience the confidence to make a smart, data-backed decision.
A modern market research report template completely flips this script. It doesn't just present data; it interprets it. Each slide is a deliberate step in a logical argument, guiding stakeholders from "Here's what's happening" to "Here's what we must do next."
Learning the principles behind writing reports that get real results is what separates a static document from a persuasive tool that genuinely drives change. It's a fundamental shift in thinking, but it's essential for making a real impact.
The Slide-by-Slide Blueprint for Your Template
Let's move beyond the dreaded data dump. A truly effective market research report isn't just a collection of facts; it's a narrative. Each slide should logically connect to the next, guiding your audience on a journey that culminates in a clear, actionable conclusion. What we're building here is a proven framework that organizes your findings into a persuasive story.
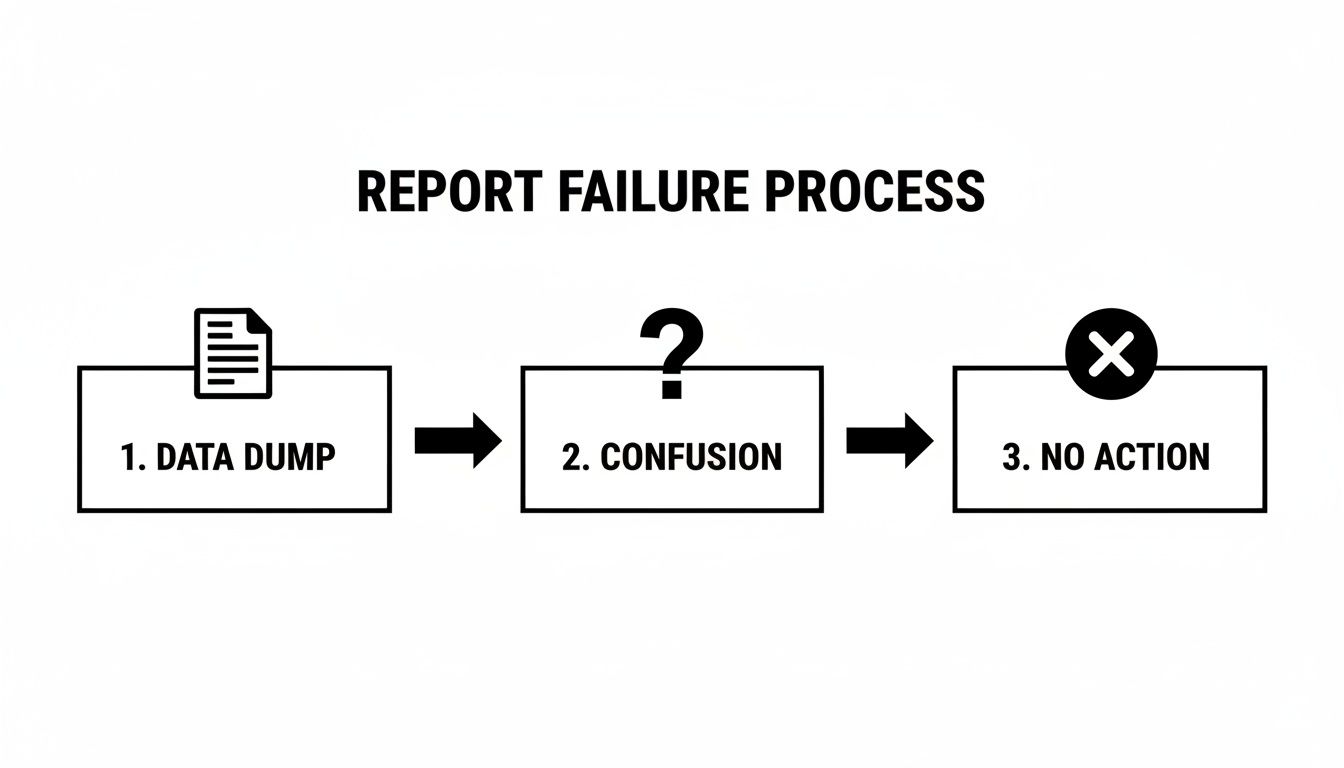
We've all seen reports that miss the mark. They start with a deluge of raw data, which only leads to confusion for the audience and, ultimately, no real action is taken. That's the fast track to getting your hard work ignored.
A narrative-driven template helps you completely sidestep this common pitfall. Instead of forcing stakeholders to connect the dots themselves, you're presenting a finished puzzle.
A structured report needs a solid foundation. The following table outlines the essential slides that form the backbone of a high-impact presentation, detailing what each one should achieve and the best ways to visualize the information.
Essential Slides for a High-Impact Market Research Report
| Slide Title | Primary Objective | Key Data & Visualization |
|---|---|---|
| Executive Summary | Deliver the entire story in brief—key findings and recommendations—for time-crunched executives. | Bullet points for top insights, concise text. No complex charts. |
| Market Overview & Sizing | Establish the context by defining the market’s scale, growth trajectory, and overall health. | Bar charts for TAM/SAM/SOM, line graphs for historical growth. |
| Competitive Landscape | Identify key competitors, their market share, and their strategic strengths and weaknesses. | 2x2 matrix (e.g., Price vs. Quality), stacked bar charts for market share. |
| Customer Segmentation | Introduce distinct customer personas, highlighting their needs, behaviors, and motivations. | Persona cards with demographic/psychographic data, heat maps for behaviors. |
| Key Findings & Insights | Detail the most critical discoveries from the research, supported by direct evidence. | Quote callouts, data tables, annotated charts that highlight the "so what." |
| Strategic Recommendations | Translate the insights into clear, actionable steps the business should take next. | Numbered list of recommendations, impact/effort matrix. |
| Methodology & Sourcing | Build credibility by transparently explaining how the data was collected and analyzed. | Simple text slide detailing sources, sample sizes, and dates. |
| Appendix | Provide supplementary data and detailed charts for those who want to dig deeper. | Full data tables, expanded charts, links to raw sources. |
By following this sequence, you ensure your report flows logically, making it much easier for your audience to absorb the key takeaways and buy into your recommendations.
Crafting the Executive Summary
Think of this as the most important slide in your entire deck. It's your one shot to grab the attention of a busy executive and convince them the rest of the report is worth their time.
The executive summary needs to be a complete, standalone story. It's not a teaser; it's the whole narrative in miniature. For a deeper dive, there are some excellent resources out there on writing compelling executive summaries that can help you nail the tone and structure.
It absolutely must cover:
- The Core Problem: What business question or challenge kicked off this research in the first place?
- Key Findings: What are the top 2-3 most critical insights you uncovered?
- Strategic Recommendations: Based on everything you learned, what specific actions should the company take?
If a stakeholder only reads this single slide, they should walk away with the main message and a clear sense of direction.
Defining the Market Landscape
Once you've hooked them, it's time to set the stage. The Market Overview slide provides crucial context by defining the size, health, and trajectory of your industry.
The cornerstones here are TAM (Total Addressable Market), SAM (Serviceable Available Market), and SOM (Serviceable Obtainable Market). Getting these right is critical. In my experience, businesses that use a structured template for this see a 30-50% improvement in the accuracy of their market sizing projections.
This slide has to make abstract numbers feel real. A waterfall chart is fantastic for visualizing market growth over several years, while a simple stacked bar chart can instantly clarify market share distribution among key players.
Unpacking Customer Segments
With the market defined, you now need to bring the customers to life. A vague, one-size-fits-all "average customer" profile just doesn't cut it anymore. This is where you break down your audience into distinct, data-backed segments.
Flesh out these personas with real data, focusing on:
- Demographics: Age, location, income, etc.
- Psychographics: Their values, pain points, and motivations. What keeps them up at night?
- Behaviors: How do they buy? Where do they shop? How do they use products like yours?
A powerful segmentation slide doesn't just list who the customers are; it explains why they make the choices they do. This is the insight that connects your market data directly to a winning go-to-market strategy.
Heat maps are an incredibly effective tool here. You can instantly show the concentration of certain traits across different groups. Imagine a heat map that highlights which segment has the highest purchase frequency combined with the lowest price sensitivity—that’s your golden ticket, pointing your team straight toward their most valuable audience.
Turning Competitor Data Into Strategic Insights
Any decent competitive analysis goes beyond just listing who else is in the game. The real goal is to turn that raw data into a strategic roadmap. You're not just looking at where your competitors are now, but trying to predict their next move to find your own strategic openings.
Simply jotting down a competitor's revenue or team size is surface-level stuff. The real story is in the details. You get true insight when you start evaluating them across more meaningful dimensions—things like market share, product feature parity, customer sentiment, and their growth trajectory. These are the metrics that paint a much richer picture of the competitive landscape.

Designing an Effective Competitive Matrix
A competitive matrix is your best friend here. It’s a simple, visual way to show stakeholders exactly where you stand in the market at a glance. Even a classic 2x2 matrix, maybe plotting your company and its rivals against two key axes like Price vs. Perceived Quality, can instantly highlight your unique position.
For a deeper dive, though, a feature comparison table is a must. This is where you get granular. Your matrix should break down:
- Core Product Features: Line up the key functionalities side-by-side. Who offers what?
- Pricing Models: How do their tiers, free trials, and overall value propositions stack up?
- Target Audience: Look at their marketing. Who are they really talking to?
- Key Differentiators: What’s their secret sauce? Is it their tech, their brand reputation, or their customer service?
This kind of structured approach forces you out of your assumptions and into the hard evidence. It creates a clear, side-by-side view that makes it painfully obvious where the gaps in the market are—gaps your business can jump on.
Sourcing Credible Data and Separating Signal From Noise
Now, you need to fill that matrix with reliable data. A word of warning: don't just rely on a competitor's marketing website. That's their highlight reel, designed to look perfect. To get a real, unvarnished view, you need to diversify your sources.
I always recommend a mix of these for a well-rounded analysis:
- Customer Reviews: Sites like G2, Capterra, or Trustpilot offer unfiltered feedback from actual users. You’ll find both strengths and, more importantly, weaknesses.
- Third-Party Analyst Reports: Industry reports from firms like Gartner or Forrester often contain verified market share data and expert takes.
- Public Financial Filings: If your competitors are public, their quarterly and annual reports are gold mines of information on performance and strategy.
The real challenge isn't just collecting data; it's distinguishing 'table stakes' capabilities from true market differentiators. Table stakes are the features everyone expects. Differentiators are what make a customer choose one company over another.
A solid framework for mapping competitors by strategy, pricing, and positioning is critical for spotting these differentiators. In my experience, well-structured competitive intelligence can improve go-to-market win rates by as much as 25%. If you want to build an even stronger analysis, it’s worth exploring detailed guides on mapping the competitive landscape from mixbright.com.
Ultimately, this part of your market research report template has to deliver a clear verdict. It needs to answer the big questions: Where do we win today? Where are we vulnerable? And where can we create an unbeatable advantage for the future? This is how you turn a pile of competitor data into a catalyst for decisive action.
Tailoring Your Report for Different Stakeholders
A brilliant market research report can fall completely flat if it doesn't speak the right language to the right audience. I’ve seen it happen. You spend weeks on deep analysis, only for your findings to get a polite nod and then sit on a server, unused.
A one-size-fits-all approach is a recipe for inaction. What your CEO needs to know is fundamentally different from what your product team or sales force requires to do their jobs well. Customizing your market research report template isn't just a nice-to-have; it’s the only way to make sure your insights actually spark change.
The same dataset can, and should, tell three very different stories. For leadership, it’s all about the bottom line and strategic direction. For product teams, it’s about the nitty-gritty details that shape the development roadmap. And for sales, it’s about battlefield intel and customer pain points. Your template has to be flexible enough to serve all three masters without forcing you to create three separate reports from scratch.
Customizing for the C-Suite
When you're in front of executives, your mantra has to be brevity and impact. Time is their most precious commodity. They’re thinking at 30,000 feet, constantly connecting market shifts to financial outcomes and long-term business strategy.
Your executive-facing report needs a sharp focus:
- Lead with the recommendation. Don't bury the lede. Start with the "so what" right away.
- Talk money. Zero in on metrics like market size (TAM/SAM/SOM), potential revenue impact, and a clear-eyed risk analysis.
- Keep visuals simple. A single, well-annotated line graph showing market growth is infinitely more powerful than a dense data table. The goal is a story at a glance.
The C-suite version of your report is an intelligence briefing, not a research encyclopedia. If they can grasp the core message and recommended action in five minutes, you've nailed it.
Equipping Product and Engineering Teams
Your product and engineering colleagues live in a different world. They crave depth and specificity because they're the ones who have to turn insights into reality. They need the raw materials—the detailed data—to make thousands of tiny decisions that add up to a successful product.
Here, the presentation needs to get granular:
- Dig into customer feedback. This is where you include direct quotes and detailed pain points from user interviews. The raw voice of the customer is gold for them.
- Provide a deep dive on competitive features. A side-by-side analysis highlighting specific gaps and opportunities is immediately actionable.
- Spotlight technical trends and user behavior patterns that could influence product architecture or how they prioritize the next sprint.
Empowering the Sales Force
Finally, your sales team needs practical, actionable intelligence they can use on the front lines, today. They don't have time for the intricacies of your methodology; they just need to know how to win deals.
For the sales team, frame your insights around winning:
- Create Battle Cards. Distill competitor weaknesses and your key differentiators into easily digestible bullet points they can pull up before a call.
- Anticipate Customer Objections. Use your research to script compelling, evidence-based responses to common sales hurdles.
- Refine the pitch. Show them which customer segments respond best to which value propositions so they can tailor their messaging.
The need for this kind of adaptable reporting isn't just a theory; it’s a clear trend. The push for efficiency and automation is everywhere. Consider that 94% of marketers now plan to use AI for content creation, including reports. This makes having a versatile, easy-to-adapt template more critical than ever. You can discover more about marketing trends at HubSpot that underscore this very shift.
By tailoring your output, you transform a static document into a dynamic tool that drives intelligent action across the entire organization.
Generate Your Foundational Report in Minutes
Let's be honest: building a market research report from the ground up is a grind. Before you can even get to the interesting part—the actual analysis—you're looking at weeks, sometimes months, of pure data wrangling. It's a tedious process of gathering, cleaning, and structuring everything.
This isn't just a time sink; it's a significant budget item. A traditional market research project can easily run anywhere from $5,000 to over $50,000, all depending on how deep you need to go and what methods you're using.
That delay is a killer. It creates a massive bottleneck when your team needs to make a smart decision now. By the time you get a credible answer, the opportunity might have already passed you by. It’s a frustrating cycle that eats up valuable time and resources.
Thankfully, there’s a much smarter way to get your initial data organized and visualized.
Accelerate Your Research with Automation
This is where tools like StatsHub.ai completely change the game. Instead of manual labor, you get an editable, slide-ready presentation in minutes. By automating all that upfront data collection and report building, these platforms essentially give you a massive head start. You get to skip the grunt work and dive right into the high-value strategic thinking.
For a simple one-time fee, you can get a comprehensive baseline analysis that includes:
- A sharp executive summary with a clear, decision-ready outlook.
- In-depth market sizing, historical growth rates, and projections.
- Competitive benchmarking that lines up key players on financial and operational metrics.
- Clear segmentation analysis broken down by type and application.
The output is practically instant, giving you a structured report ready for your input.

As you can see, you just define your industry, and the platform delivers a structured, slide-ready foundation. This frees you up to focus your expertise on what really matters: interpreting the data, crafting a compelling narrative, and guiding your stakeholders.
Think about it this way: instead of burning 80% of your time on research logistics, you can now invest that time in deriving strategic insights and influencing key business decisions.
At the end of the day, using an automated tool to generate your foundational market research report template is all about efficiency. It hands you a solid, data-backed starting point in a fraction of the time and cost, empowering your team to act faster and with more confidence.
Answering the Tough Questions About Market Research Reports
Even with the best template in hand, you'll inevitably hit a few roadblocks while putting your report together. These are the practical, real-world questions that pop up when the data is messy and deadlines are tight. Let's walk through some of the most common ones I've encountered.
How Do I Handle Qualitative Data?
This is a classic challenge. You've done a dozen customer interviews, and now you're staring at pages of transcripts, wondering how to fit all that rich, nuanced feedback into a clean, data-driven slide deck. Simply dropping in raw text is a non-starter—it’s dense and gets ignored.
The trick is to distill, not just summarize. Comb through your notes and group the feedback into distinct themes. For example, instead of just saying "customers found the onboarding confusing," you create a theme called "Onboarding Friction."
Then, for each theme, pull out one or two killer quotes that bring the point to life. Don't just paraphrase; use their exact words and put them in a blockquote to make them pop on the slide. This adds a layer of authenticity that a simple summary can't match. The final step? Create a summary slide that explicitly links these qualitative themes back to your hard data, showing how the "why" from your interviews perfectly explains the "what" in your numbers.
What’s the Right Length for a Report?
Everyone wants to know the magic number, but there isn't one. The real guiding principle is clarity over volume. Your goal is to be thorough enough to be credible but brief enough that a busy executive will actually read it. From my experience, a powerful, slide-based report usually lands in the 15-25 slide range.
A report that's too long just buries its own insights. Think of it as telling a focused story. Anything that isn't core to that narrative can be moved to an appendix for those who want to dig deeper.
This length gives you enough room to cover the essentials—your executive summary, market size, competitive analysis, and strategic recommendations—without fatiguing your audience. Be ruthless in your editing. If a slide doesn't directly support your main argument, it probably doesn't belong in the main deck.
How Often Does This Research Need to Be Updated?
The answer here depends entirely on how fast your market moves. If you're in a dynamic space like consumer tech or SaaS, the competitive landscape can change dramatically in a single quarter. For these industries, a quarterly refresh isn't overkill; it's essential for staying relevant.
On the other hand, if you're in a more mature, stable market, an annual or bi-annual update is probably fine. You're looking for major shifts, not minor fluctuations.
The real test is simple. Ask yourself: "Does this report still reflect the reality our sales and product teams are facing out in the wild?" The moment that answer feels like a "no," it's time for an update. Your market research report should be a living document, not a historical artifact.
Ready to skip the manual grind and get a data-rich, slide-ready foundation in minutes? StatsHub.ai delivers a comprehensive market analysis instantly, so you can focus on strategy, not spreadsheets. Get your first report for just $15 at StatsHub.ai.
Ready to move faster?
Generate a market report in minutes, not weeks.
$49, easy to share, and ready for your team.