7 Strategic Competitive Analysis Report Example Breakdowns for 2026
Explore our 2026 breakdown of a strategic competitive analysis report example to learn how to turn data into decisive action. Get templates and tips.
In fast-moving markets, a generic list of competitors is insufficient. You need a strategic competitive analysis that uncovers weaknesses, reveals opportunities, and provides a clear roadmap for winning your category. The difference between a good report and a great one lies in its ability to translate raw data into actionable insights that leadership can trust and act on immediately.
However, creating a compelling report from scratch is a time-consuming process fraught with potential pitfalls, from data overload to a lack of strategic focus. This guide cuts through the noise. We will deconstruct seven real-world competitive analysis report example templates and platforms, showing you not just what to include, but how to structure the analysis for maximum impact. You will see firsthand how to move beyond simple data points to build a narrative that drives confident decisions.
Each example in this listicle includes a detailed breakdown, screenshots, and direct links to the source. You will learn replicable methods for creating:
- Slide-ready executive summaries
- Defensible market sizing and share analysis
- Clear competitor benchmarking tables
- Actionable SWOT or feature-gap analyses
We'll explore how to identify the right key performance indicators, benchmark against the right players, and present your findings in a way that gets you from question to strategic answer, fast. Whether you're a strategy consultant, a product manager, or a startup founder, this curated list will equip you with the tools and techniques to build a competitive analysis report example that truly informs and influences business strategy.
1. StatsHub.ai: The Instant, AI-Powered Report Generator
StatsHub.ai stands out as a powerful and highly efficient tool for generating comprehensive market and competitive analysis reports. Unlike traditional research methods or complex software, it delivers structured, data-rich reports in minutes, making it an indispensable resource for professionals needing to move quickly from a market question to a credible, data-backed answer. This platform is specifically engineered for speed and clarity, positioning itself as the go-to solution for rapid opportunity assessment and strategic planning.
Its primary strength lies in its ability to condense what would typically be days or weeks of research into a single, automated workflow. For a one-time fee of $15 and no recurring subscription, users can input a market keyword and receive a downloadable, slide-ready analysis. This accessibility and straightforward pricing model democratizes access to high-quality market intelligence, which is often gated behind expensive subscriptions.
Strategic Breakdown: Key Features and Advantages
StatsHub.ai’s value proposition is built on several core pillars that make it an exceptional competitive analysis report example generator.
- Comprehensive Structure: Each report is logically organized to support strategic decision-making. It begins with a high-level executive summary and market outlook, then drills down into granular detail, including global market size (TAM/CAGR), regional breakdowns (Americas, APAC, Europe, MEA), and segmentation by type and application.
- Actionable Competitive Benchmarking: The platform’s standout feature is its auto-generated competitive benchmarking table. This component provides a clean, direct comparison of key players on critical metrics like revenue, 5-year CAGR, net margin, and regional dependence. This data is structured for immediate use in presentations, saving analysts significant time.
- Built-in Credibility and Transparency: A common pitfall of AI-generated content is a lack of verifiable sources. StatsHub.ai addresses this directly by including a methodology section and citing its data sources in every report. This transparency allows users to confidently defend their findings in high-stakes meetings with leadership or investors.
- User-Centric Experience: The platform is designed for simplicity and trust. Users can generate a free preview report in 1-3 minutes without providing credit card information. The final outputs are delivered as both a PDF and an editable format, facilitating seamless integration into existing workflows and slide decks.
Strategic Insight: The true power of StatsHub.ai is its ability to serve as a "market sanity-check" tool. It provides a robust baseline of data that allows teams to validate assumptions, size opportunities, and understand the competitive landscape before committing significant resources to deeper, more customized research projects.
Tactical Application and Use Cases
The utility of StatsHub.ai spans across various professional roles, each benefiting from its speed and structured output.
| User Profile | Primary Use Case | Actionable Takeaway |
|---|---|---|
| Strategy Consultant | Quickly generate a foundational market map and competitive set for a new client engagement. | Use the TAM/CAGR and regional data to frame the initial "state of the market" slides. Drop the competitor table directly into the kickoff deck. |
| Startup Founder | Validate a business idea by assessing market size, growth potential, and key incumbents. | Leverage the demand/supply drivers and barriers section to refine the value proposition and anticipate market challenges for an investor pitch. |
| Product Manager | Benchmark competitor performance and identify feature gaps or market positioning opportunities. | Analyze the competitor table's regional dependence metric to spot geographic markets where dominant players are weak, revealing expansion opportunities. |
| Investor | Conduct rapid due diligence on a target company's market and competitive positioning. | Use the report as a first-pass filter to quickly screen dozens of potential deals, focusing deeper analysis only on the most promising opportunities. |
Replication Tip: To maximize the value of a StatsHub.ai report, use its output as the structured foundation for a more detailed analysis. Export the editable version and add your team’s proprietary insights, customer interview data, and specific strategic recommendations to create a hybrid report that combines automated efficiency with bespoke strategic thought. This approach transforms a $15 report into a customized, high-impact strategic asset.
Visit StatsHub.ai to generate a free preview report.
2. SlideModel
SlideModel offers a different take on the competitive analysis report example by providing professionally designed, fully editable presentation templates. Rather than offering a static report to study, it provides the structural and visual framework for you to build your own executive-ready analysis. This is invaluable for analysts, product managers, and consultants who need to present findings in a clear, compelling, and visually consistent format, saving hours of design work.
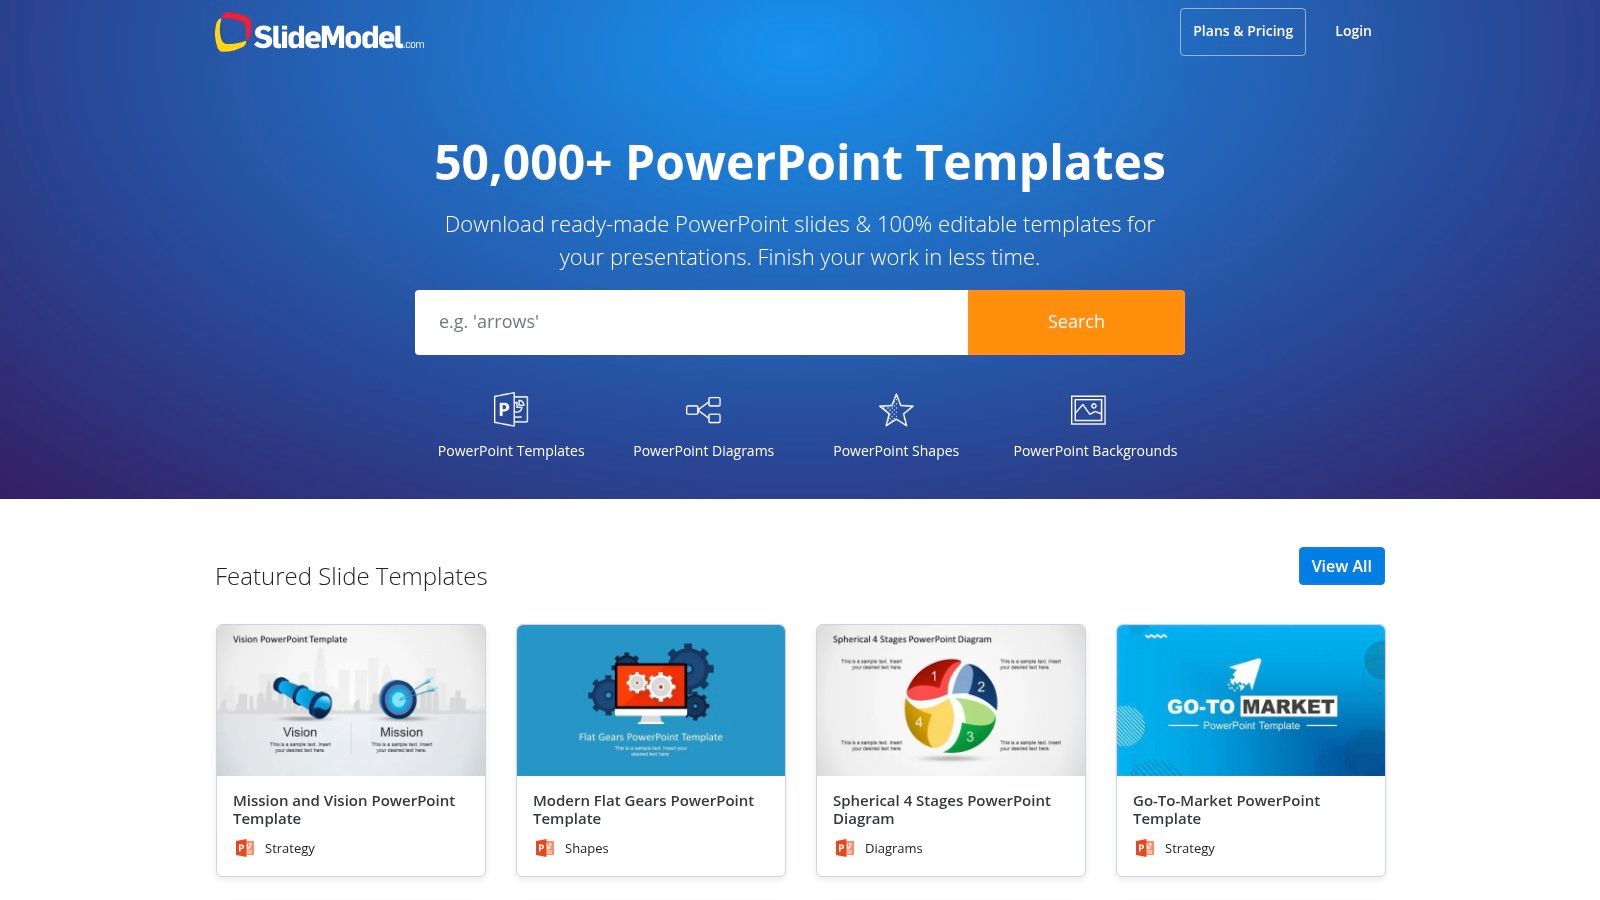
The platform’s core strength is its vast library of templates compatible with PowerPoint, Google Slides, and Keynote. For competitive analysis, SlideModel provides dozens of layouts, from classic SWOT and Porter's Five Forces diagrams to feature comparison matrices and market positioning maps. These templates aren't just single slides; they often come in multi-slide packs designed to guide you through a complete competitive narrative.
Strategic Breakdown and Use Cases
Key Offering: SlideModel’s primary value is speed and polish. It allows you to focus on the quality of your data and insights, knowing the final presentation will look professional. The templates are 100% editable, so you can adapt colors, fonts, and layouts to match your company's branding guidelines.
User Experience: The website is straightforward to navigate. You can search specifically for "competitive analysis," and the results provide a visual preview of each template. However, to download any resource, a subscription is required. While pricing isn't always visible on individual template pages, the platform operates on a subscription model offering unlimited downloads, which is cost-effective for frequent presenters.
Strategic Takeaway: Use SlideModel to standardize your team's reporting. By adopting a set of pre-approved templates for competitive benchmarks, you ensure consistency and clarity across all presentations, making it easier for stakeholders to digest information quickly.
Actionable Insights and Replication Tips
To get the most out of SlideModel, start by identifying the core message of your analysis. Are you comparing product features, market share, or customer sentiment? Choose a template that best visualizes that specific narrative.
- For Product Teams: Use the feature comparison matrix templates to clearly map your product against competitors. The visual layout helps identify gaps and opportunities at a glance.
- For Strategy Consultants: Leverage the multi-slide "Competitive Analysis Report" packs. These provide a logical flow from market overview to competitor profiles and strategic recommendations.
- For Sales Leaders: Use the simple competitor scorecard slides to arm your sales team with quick, digestible battle cards highlighting your key differentiators.
After building out your slides, you'll need an efficient way to circulate the report. Learning how to share your PPT online securely ensures your stakeholders can access the latest version of your analysis without file-sharing hassles.
Website: https://slidemodel.com
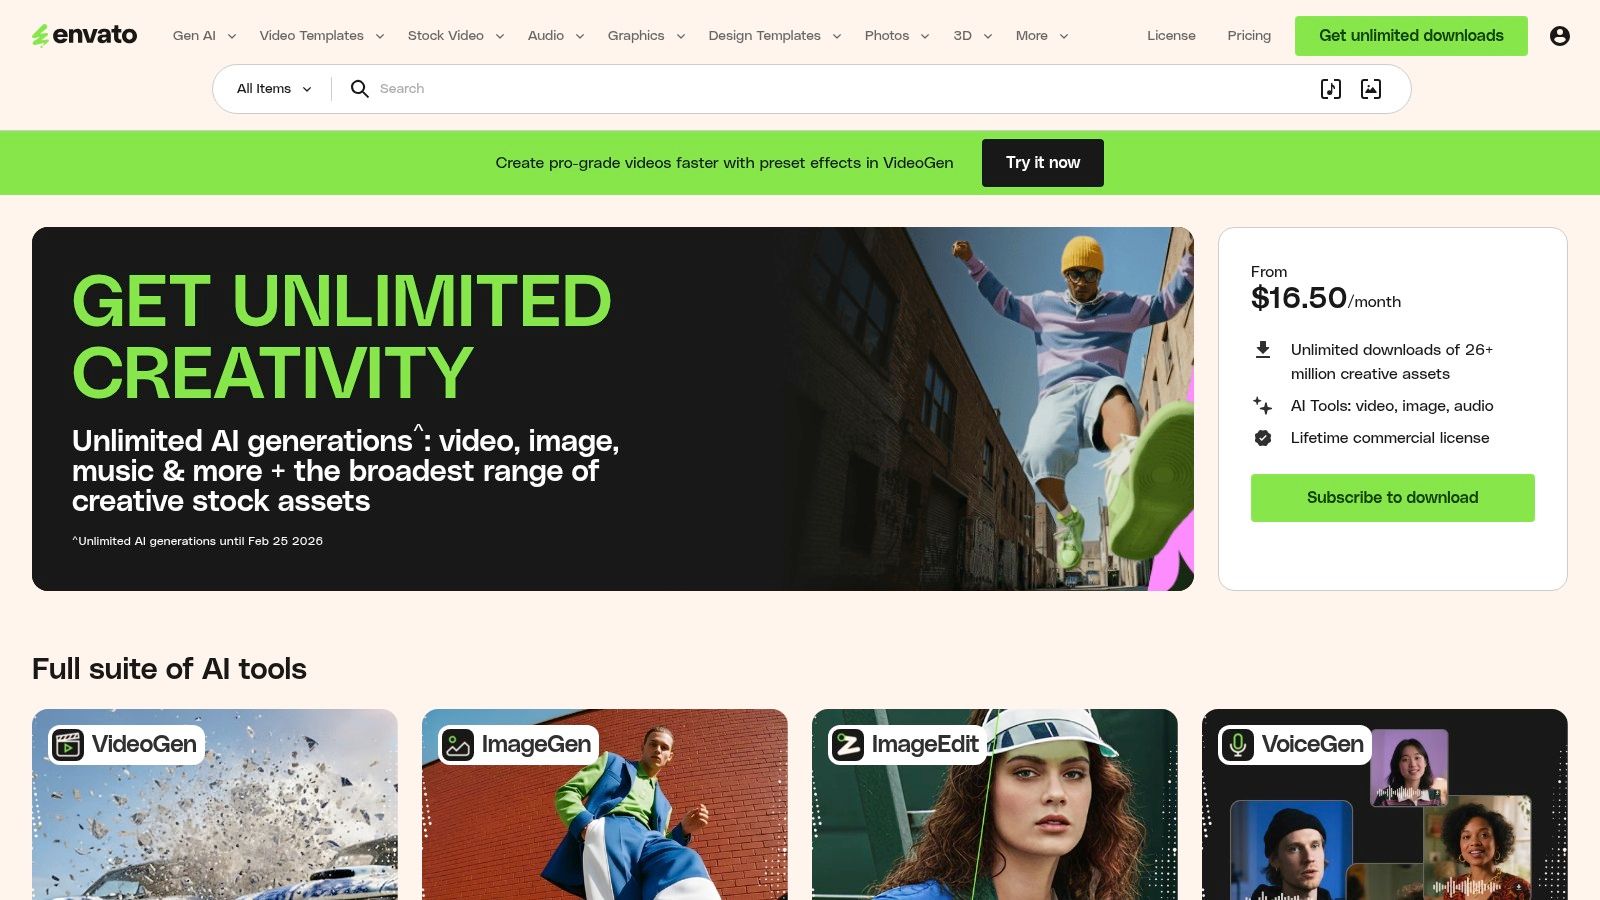
3. Envato Elements
Envato Elements provides a massive, subscription-based library of creative assets, including a vast selection of competitive analysis presentation templates. Unlike platforms that offer a single report, Envato Elements gives users unlimited access to thousands of creator-produced templates for PowerPoint, Keynote, and Google Slides. This makes it an exceptionally cost-effective solution for agencies, consultants, or in-house teams that need a constant supply of diverse, professionally designed frameworks for their competitive analysis report examples.
The platform's strength lies in its sheer volume and variety. You can find everything from minimalist, corporate-style decks to bold, data-visualization-heavy templates. This allows you to select a design that perfectly matches your company’s branding or the specific tone of your report. Each template typically includes a range of slide types, such as SWOT analysis, competitor profiles, market share charts, and feature comparison tables, providing a comprehensive toolkit for building a compelling analysis from scratch.
Strategic Breakdown and Use Cases
Key Offering: Envato Elements offers unparalleled value through its "all-you-can-download" model. A single subscription grants access to millions of assets beyond just presentations, including stock photos, graphics, and video templates. For competitive analysis, this means you can create a high-quality report and enhance it with other professional assets without incurring extra costs.
User Experience: The platform is user-friendly, with powerful search filters that let you narrow down results by application (e.g., PowerPoint), color, and orientation. Pricing is transparent, with clear monthly or annual subscription options for individuals, teams, and enterprises. However, since the templates are created by independent authors, the quality and structure can vary, and direct support for a specific template comes from the author, not Envato itself.
Strategic Takeaway: Use Envato Elements to experiment with different visual storytelling formats for your competitive analysis. The unlimited downloads allow your team to test various template styles to see which resonates best with stakeholders, without the financial commitment of purchasing each one individually.
Actionable Insights and Replication Tips
To maximize Envato Elements, think of it as a creative arsenal rather than a single solution. Download several templates that catch your eye and mix and match the best slides from each to create a customized master deck that fits your exact needs.
- For Marketing Agencies: Use the wide variety of styles to create bespoke competitive analysis reports for different clients. Match the template design to each client's brand identity for a polished, custom-tailored feel.
- For Startups: Leverage the budget-friendly subscription to access high-quality presentation designs that make your pitch decks and investor updates look like they were designed by a professional firm. Focus on templates that highlight market opportunity and competitor weaknesses.
- For Corporate Strategy Teams: Find a clean, data-centric template and establish it as your team’s standard. The commercial license included in the subscription simplifies compliance for company-wide use.
Once you’ve selected and customized your slides, the next step is filling them with accurate, timely data. This is where AI-powered tools can accelerate your workflow, helping you populate your polished templates with the insights needed to make strategic decisions.
Website: https://elements.envato.com
4. HubSpot (Free Competitive Analysis Templates)
HubSpot offers a practical entry point into competitive analysis through its collection of free, downloadable templates. Unlike platforms that provide finished reports, HubSpot equips marketing, sales, and product teams with structured frameworks in familiar formats like Excel, Word, and Google Docs. These resources are designed to guide users through the process of gathering and organizing competitive data, making them an excellent starting point for those building their first comprehensive competitive analysis report example.
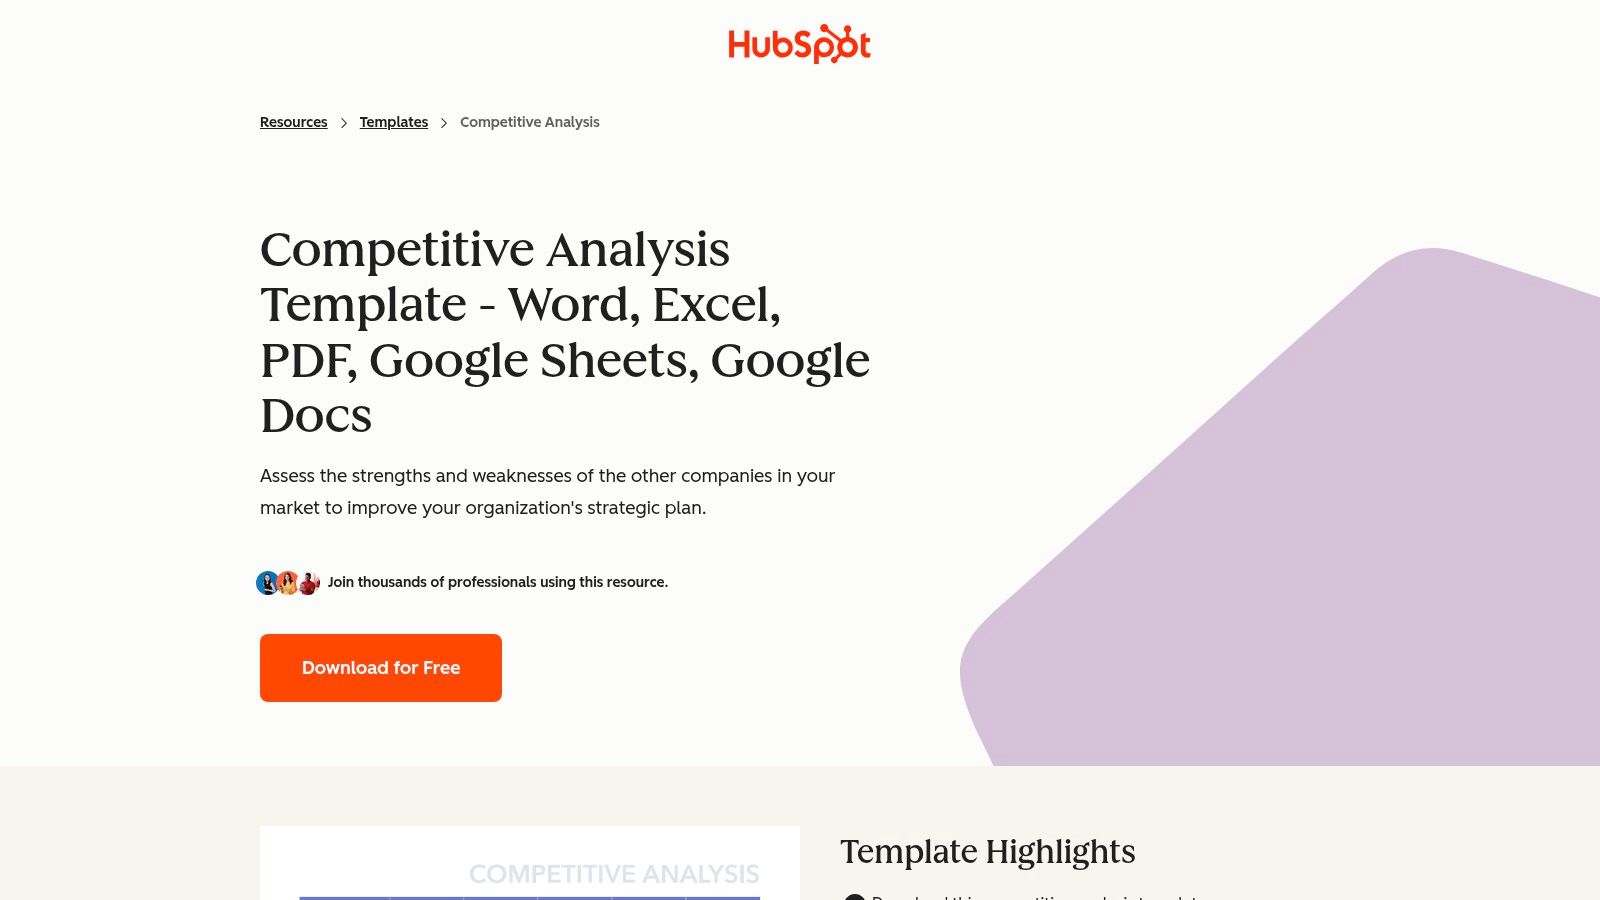
The platform's strength lies in its accessibility and educational approach. The templates, which include SWOT analysis charts, feature comparison matrices, and market positioning worksheets, are accompanied by instructional content. This combination of tools and guidance demystifies the analysis process, making it approachable for startups, small businesses, and junior analysts who need a solid foundation without a significant financial investment.
Strategic Breakdown and Use Cases
Key Offering: HubSpot’s value is providing credible, no-cost starter kits. The templates serve as a blueprint, ensuring you cover essential areas like competitor product features, pricing, marketing strategies, and market share. Because they come in standard office formats, they are easily integrated into existing workflows and internal documents.
User Experience: Accessing the templates is simple but requires submitting an email address via a lead-generation form. Once submitted, the files are delivered directly to your inbox. While the templates are well-structured, they are inherently generic and require significant customization to capture industry-specific nuances and present a sophisticated analysis.
Strategic Takeaway: Leverage HubSpot's templates to establish a baseline competitive intelligence program. The structured format helps train new team members on what data to collect and how to organize it, creating a standardized data-gathering process before you invest in more advanced analytics software.
Actionable Insights and Replication Tips
To maximize the value of HubSpot’s templates, treat them as a starting point, not a final product. The initial structure is a guide for data collection, but the real insight comes from your unique analysis and visual presentation.
- For Marketing Teams: Use the marketing analysis template to systematically track competitor content, SEO performance, and social media engagement. This creates a quantifiable baseline to measure your own efforts against.
- For Product Managers: Adapt the feature comparison matrix in Excel or Google Sheets to include user-specific value propositions. Don't just list features; score them based on customer impact and execution quality.
- For Founders: The simple SWOT analysis template is a powerful tool for early-stage strategy sessions and investor pitches. Use it to clearly articulate your market position and strategic focus.
The raw data you collect in these templates will eventually need to be synthesized into a compelling narrative for stakeholders. Think of these documents as the backend database for a more polished presentation you will build later.
Website: https://www.hubspot.com/business-templates/competitive-analysis
5. Miro Templates
Miro shifts the concept of a competitive analysis report example from a static document to a dynamic, collaborative canvas. The platform offers a rich gallery of templates, including community-driven boards from its Miroverse, that serve as live frameworks for teams to build, discuss, and refine their analysis in real time. This approach is ideal for workshops, agile product teams, and any organization that values iterative collaboration over siloed report creation.
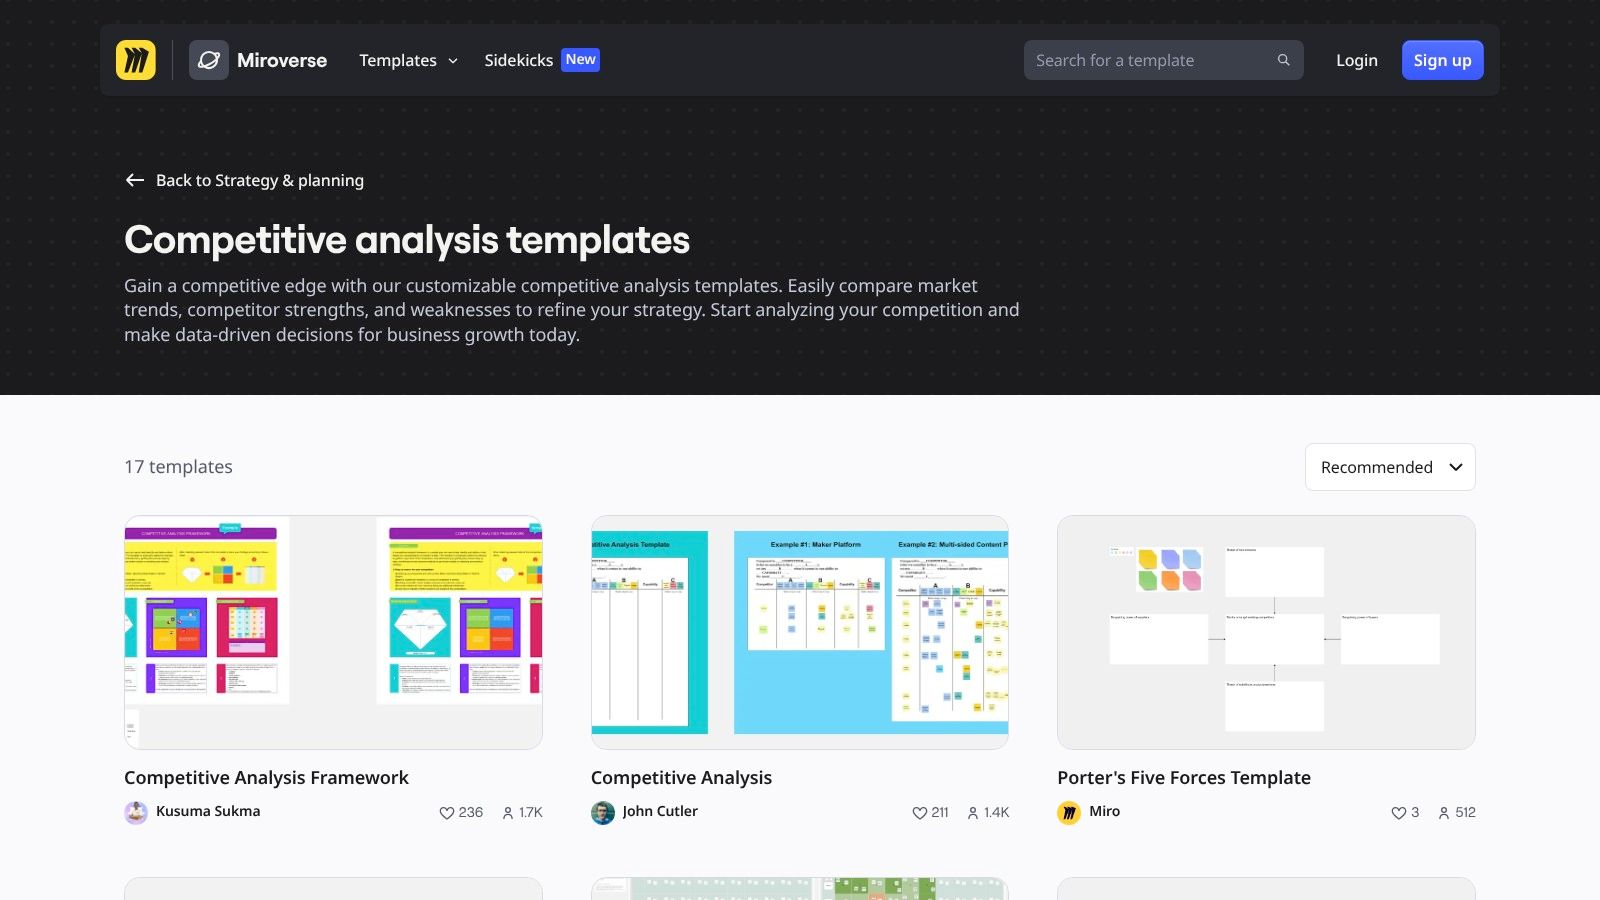
The core strength of Miro lies in its boundless, interactive workspace. Templates for competitive analysis range from simple feature comparison grids and SWOT analyses to more complex canvases that integrate user personas, value proposition mapping, and go-to-market strategies. Unlike a presentation slide, a Miro board is a persistent asset that can be revisited and updated as the market landscape evolves, making it a living document rather than a one-off report.
Strategic Breakdown and Use Cases
Key Offering: Miro’s primary value is fostering real-time, cross-functional collaboration. It breaks down the barriers between data gathering, analysis, and strategic decision-making by putting everyone in the same virtual room. The templates provide a structured starting point, ensuring workshops and brainstorming sessions are productive and focused.
User Experience: Miro’s interface is intuitive, with a drag-and-drop functionality that makes it easy for even non-technical users to contribute. Accessing templates is simple; you can browse the gallery and start using one with a single click. The platform operates on a freemium model. Its Free plan allows access to templates but limits you to three editable boards, which is perfect for testing. Scaling for team-wide use requires a paid subscription.
Strategic Takeaway: Use Miro to turn competitive analysis into a team sport. Instead of a single analyst preparing a report for review, invite product, marketing, and sales stakeholders to a collaborative session to populate the canvas together. This builds shared understanding and alignment from the outset.
Actionable Insights and Replication Tips
To maximize Miro's potential, select a template that aligns with your specific analytical goal. The platform’s versatility means you can find a framework for nearly any type of competitive intelligence work.
- For Cross-Functional Workshops: Use a comprehensive "Competitor Analysis Canvas" to guide a live session. Assign different sections (e.g., Target Audience, Pricing, Marketing Channels) to different team members to populate simultaneously.
- For Product Strategy: Leverage the feature-by-feature comparison templates to visually map out market gaps. The board can then evolve into a product roadmap brainstorming session, linking competitor weaknesses directly to potential new features.
- For Continuous Monitoring: Create a dedicated "Competitor Dashboard" board that is updated quarterly. Use integrations to pull in relevant data or links, and treat it as the central source of truth for your competitive landscape.
Miro's ability to create a live, visual competitive analysis report example makes it an indispensable tool for modern, agile teams that need to move from insight to action quickly.
Website: https://miro.com/templates/competitive-analysis
6. Statista
Statista is a leading provider of market and consumer data, making it a foundational resource for anyone building a data-driven competitive analysis report. Instead of offering a pre-written report template, Statista provides the credible, citable statistics, charts, and industry reports needed to populate your analysis with authoritative data. It serves as a data backbone, helping analysts validate assumptions and benchmark performance against industry standards with verifiable figures.
 and identify growth trends. This provides essential context before diving into competitor specifics.
- For Competitor Benchmarking: Search for your competitors by name to find available data on their revenue, employee numbers, or brand recognition. Use these figures to create a quantitative comparison chart.
- For Understanding Customers: Leverage the consumer survey data to analyze customer preferences and pain points within your industry. This can reveal strategic gaps that competitors are failing to address.
By integrating Statista's charts and figures directly into your report, you elevate its quality and ensure your strategic recommendations are grounded in solid evidence.
Website: https://www.statista.com
7. IBISWorld
IBISWorld provides an institutional-grade competitive analysis report example by offering comprehensive, standardized industry research reports. Instead of providing a template to fill, IBISWorld delivers a fully-formed analysis, complete with data, forecasts, and strategic commentary. This makes it an essential resource for corporate strategists, market analysts, and investors who need authoritative, third-party data to ground their competitive assessments.
The platform’s key strength lies in its massive catalog of reports, organized by NAICS codes, covering thousands of industries in the US and globally. Each 30-40 page report follows a consistent structure, featuring dedicated chapters on the competitive landscape, market share concentration, and profiles of key players. This standardized format allows users to quickly extract relevant data and exhibits for their own presentations.
Strategic Breakdown and Use Cases
Key Offering: IBISWorld’s primary value is its depth and credibility. Its reports include sections built around frameworks like Porter's Five Forces, analyzing barriers to entry, buyer/supplier power, and the threat of substitutes. This provides a robust foundation for anyone building a comprehensive competitive analysis, saving hundreds of hours of primary research.
User Experience: The website is designed for research professionals. You can search by industry keyword or NAICS code to find relevant reports. While report summaries are often available for free, accessing the full 30-40 page PDF requires a purchase or a subscription. The high per-report cost makes it a premium tool, but the depth of analysis often justifies the investment for high-stakes projects.
Strategic Takeaway: Leverage IBISWorld reports as the "source of truth" to validate your internal assumptions. Use their market share data and competitor profiles to benchmark your own position and inform your strategic planning with objective, expert analysis.
Actionable Insights and Replication Tips
To maximize the value of an IBISWorld report, treat it as a foundational asset rather than a final product. Extract key charts, data points, and qualitative insights to build your own customized analysis.
- For Market Analysts: Lift the "Competitive Landscape" chapter directly to create a baseline for your own report. Use their list of top companies and market share data as a starting point for a deeper dive.
- For Startup Founders: Use the "Barriers to Entry" section to understand the challenges you'll face and to articulate your unique competitive advantage to investors.
- For Corporate Development: The detailed industry outlook and performance data are invaluable for M&A screening and due diligence, helping you assess a target company's market position.
The standardized format makes it easy to pull specific exhibits, like competitive matrices and market share pies, directly into your own presentations, giving your internal reports a stamp of professional credibility.
Website: https://www.ibisworld.com
Top 7 Competitive Analysis Report Comparison
| Item | Implementation complexity 🔄 | Resource requirements ⚡ | Expected outcomes 📊⭐ | Ideal use cases 💡 | Key advantages ⭐ |
|---|---|---|---|---|---|
| StatsHub.ai | Low 🔄 — fully automated, instant report generation | Low ⚡ — $15 one‑time, web access | High 📊⭐ — slide‑ready market report, TAM/CAGR, benchmarking | Quick market sanity checks, PMs, founders, GTM teams | Fast, affordable, defensible reports with editable slides |
| SlideModel | Low‑Med 🔄 — select and edit templates | Med ⚡ — subscription, PPT/Slides skills | Med 📊⭐ — polished, consistent executive slide layouts | Building executive decks and competitive slide sections | High visual quality and multiple competitive models |
| Envato Elements | Low 🔄 — download and customize templates | Med ⚡ — Elements subscription, author variation | Med‑High 📊⭐ — broad template library across formats/brands | Teams needing many templates across brands/formats | Unlimited downloads; cost‑effective for volume |
| HubSpot (Free Templates) | Low 🔄 — downloadable plug‑and‑play templates | Low ⚡ — free (email gated), common office tools | Low‑Med 📊⭐ — credible starter templates with guidance | Quick starts, training, small teams, internal reports | Free, reputable templates and how‑to guidance |
| Miro Templates | Low‑Med 🔄 — set up collaborative boards, facilitation | Med ⚡ — free tier (limited) or paid for scale; user accounts | Med‑High 📊⭐ — interactive, iterative collaborative analyses | Workshops, stakeholder reviews, real‑time collaboration | Live collaboration and integration with workflows |
| Statista | Low 🔄 — search and download authoritative data | High ⚡ — paid subscription/licensing for full access | High 📊⭐ — citable statistics and downloadable charts | Validating analyses, sourcing authoritative benchmarks | Authoritative, frequently updated industry data |
| IBISWorld | Low‑Med 🔄 — standardized report consumption and extraction | High ⚡ — per‑report cost or membership required | High 📊⭐ — in‑depth industry reports, competitive forces | Executive/strategic planning, deep industry analysis | Detailed, structured reports (Porter’s Five Forces, company benchmarks) |
Your Blueprint for a High-Impact Competitive Analysis
Throughout this guide, we've dissected a variety of competitive analysis report examples, moving beyond static templates to reveal the strategic frameworks that drive them. The core lesson is clear: a truly effective report is not a one-size-fits-all document but a dynamic, purpose-built asset. It’s an analytical narrative that blends quantitative data with qualitative insights to inform high-stakes decisions.
From the comprehensive market landscapes generated by StatsHub.ai to the collaborative brainstorming canvases in Miro, we’ve seen that the modern competitive analysis workflow is a multi-tool process. The goal is to move from raw data collection to strategic storytelling efficiently. An exceptional report doesn't just present data; it interprets it, contextualizes it, and transforms it into a clear call to action.
Synthesizing Your Strategic Workflow
The most powerful takeaway is the concept of a modular workflow. Your process should adapt to your specific needs, whether you're a startup founder identifying a market niche or a product manager benchmarking features. A successful workflow combines the right elements for the job.
Here’s a blueprint for building your own high-impact analysis process:
- Foundation First: Start with a structured framework. Templates from HubSpot or Miro provide an excellent skeleton, forcing you to define your key questions and metrics upfront. This initial step ensures your analysis remains focused and purposeful.
- Data Enrichment: A report is only as credible as its data. Augment your internal findings with authoritative third-party data from platforms like Statista or IBISWorld. This adds weight and objectivity to your conclusions, making your report more persuasive to stakeholders.
- Accelerate with AI: Manual data gathering and slide creation are major bottlenecks. Leverage AI-powered platforms like StatsHub.ai to generate a comprehensive first draft in minutes. This frees up your team's most valuable resource-time-allowing you to focus on strategic interpretation, not data entry.
- Visualize the Narrative: Data becomes insight when it's communicated clearly. Use presentation-ready templates from SlideModel or Envato Elements to craft a visually compelling story. Effective charts, graphs, and layouts make complex information digestible and highlight the most critical takeaways.
Actionable Next Steps: From Analysis to Advantage
Moving forward, your objective is to embed competitive intelligence into your organization's DNA. Don’t let your report become a static document filed away after one presentation. Treat it as a living resource that evolves with the market. Before you even start populating a template, remember that identifying the right competitors is paramount. As you develop your blueprint for a high-impact competitive analysis, a crucial initial step is understanding how to accurately find competitors of a website beyond basic searches. This foundational work ensures your entire analysis is built on a relevant and accurate competitive set.
Ultimately, the best competitive analysis report example is the one you create-one that is tailored to your industry, aligned with your strategic goals, and built to drive action. By integrating the tools and techniques we’ve explored, you can elevate your analysis from a routine task to a powerful source of competitive advantage. You are now equipped not just to replicate the examples in this article, but to build a bespoke intelligence engine that fuels smarter, faster, and more confident business decisions.
Ready to build your next competitive analysis report in minutes, not days? StatsHub.ai uses AI to generate comprehensive, slide-ready market and competitive analyses, complete with market sizing, SWOT analysis, and competitor benchmarking. Turn raw data into strategic insight and start making data-driven decisions faster by visiting StatsHub.ai today.
Ready to move faster?
Generate a market report in minutes, not weeks.
$49, easy to share, and ready for your team.