How to Conduct Market Analysis: A Practical Guide to Competitive Insights
Learn how to conduct market analysis with a practical framework for sizing, benchmarking, and turning data into smarter decisions.

Before you even think about cracking open a market report or digging into data, you have to get your bearings. The first, and most crucial, step in any market analysis is to define what you're actually trying to accomplish. This means setting clear, measurable goals and figuring out who this analysis is really for.
Get this part right, and every piece of data you collect will serve a purpose. Skip it, and you'll end up drowning in a sea of interesting but ultimately useless information.
Defining Your Market Analysis Scope
So many people make the mistake of starting too broad. They'll set out to analyze something like "the electric vehicle market" and end up with a collection of random facts that don't lead to any real business decisions. It’s a classic case of analysis paralysis.
A much smarter approach is to anchor your entire investigation to a specific, high-stakes business question. This single shift forces you to be efficient and ensures your findings will actually guide your strategy. The question you ask sets the stage for everything that follows.
Frame the Problem First
Stop thinking about analyzing an industry and start thinking about solving a problem. Or maybe evaluating a specific opportunity. This perspective shift instantly sharpens your focus.
Let’s look at how this plays out in the real world:
- A startup founder shouldn't be asking, "What's the size of the SaaS market?" A better question is, "Is there a real, underserved market for a project management tool built specifically for freelance graphic designers?"
- A corporate strategist isn't tasked with a general report on renewable energy. Their focus is more likely, "Should we acquire a mid-sized solar panel manufacturer in the Southeast to capture more market share there?"
- An investor doesn't care about "fintech trends" in the abstract. They need to know, "Does this neobank's user acquisition model give it a defensible moat against the big banks over the next five years?"
See the difference? Each of these questions acts like a lens, bringing the important data into focus while filtering out the noise.
Set Clear and Measurable Goals
Once you have that killer question, you can break it down into tangible objectives. What, exactly, will this analysis allow your team to do? Your goals need to be specific enough to guide your research and, just as importantly, tell you when you're done.
The point of market analysis isn't to write an encyclopedia on an industry. It's to find just enough insight to make a specific, high-stakes decision with confidence.
Good goals are always tied to a business outcome. Say you're gearing up for a new product launch. Your objectives might look something like this:
- Pinpoint the top three customer segments that competitors are ignoring.
- Benchmark our proposed pricing against the five biggest players in the space.
- Validate that at least 20% of our target market is actually willing to pay what we plan to charge.
These goals give you a clear finish line. They turn what could be a long, academic exercise into a practical, strategic tool. The final deliverable isn't just a report; it's a roadmap for what to do next.
Calculating Your True Market Size
Once you've sharpened your focus, it's time to quantify the opportunity. This is where the rubber meets the road. Investors, executives, and product leaders all ask the same question: how big is the prize? Answering that means moving beyond vague industry numbers to build a credible, defensible model of your actual market size.
This isn't just a "nice-to-have" exercise. A solid market size calculation gives you a clear ceiling for growth, helps you justify resource allocation, and tells a compelling story to stakeholders about the potential return on their investment.
Understanding the TAM, SAM, and SOM Framework
The gold standard for sizing a market is the TAM, SAM, SOM framework. I've found it's the most effective way to carve the massive universe of potential revenue into progressively smaller, more realistic slices. Think of it like a set of Russian nesting dolls, each one fitting neatly inside the other.
- Total Addressable Market (TAM): This is the big one—the total revenue opportunity for a product or service if you somehow achieved 100% market share. It's the theoretical maximum, the entire global pie.
- Serviceable Available Market (SAM): This is the segment of the TAM you can realistically serve, constrained by things like your business model, geography, or specific industry focus. It's your slice of the pie.
- Serviceable Obtainable Market (SOM): Also known as your target market, this is the portion of the SAM you can realistically capture in the near term (think 3-5 years), factoring in competition, marketing reach, and sales channels. It's the bite you can actually take.
This top-down structure, flowing from objective to scope to audience, is absolutely fundamental to a sound market analysis.
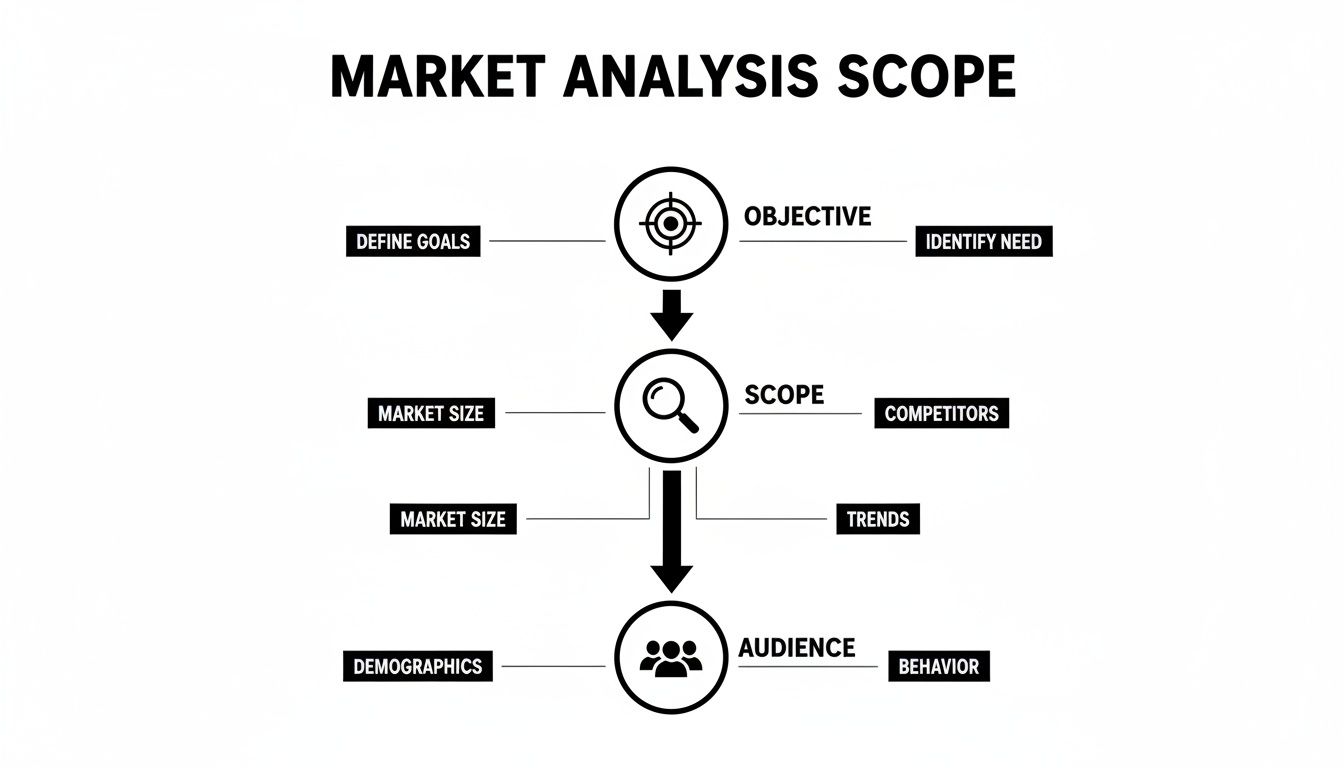
This visualization really drives home how a clear objective dictates the scope of your analysis, which in turn defines the specific audience you'll investigate.
Let's make this real. Imagine you’re launching a high-end, subscription-based project management tool specifically for creative agencies in North America.
- TAM: The entire global market for project management software, which let's say is $10 billion annually.
- SAM: The portion of that market spent by creative agencies in North America, which might be $1.5 billion.
- SOM: The share you can realistically win in the first three years, maybe $30 million, based on your go-to-market plan and the existing competition.
Suddenly, a massive, intimidating number becomes a concrete, believable target. This is the kind of story that gets budgets approved and investment deals signed.
Building Your Market Model: Top-Down vs. Bottom-Up
To get to these numbers, you need to use two distinct but complementary approaches. Any robust analysis I've ever built uses both to cross-validate the final figures.
The Top-Down Approach This method starts with broad, macro-level data—think industry reports or government statistics—and then narrows it down using logical assumptions. For instance, you might find a report stating the global cybersecurity market is $200 billion. You would then apply filters to slice it down to your specific segment (e.g., endpoint security for small businesses in Europe).
Your market size model is only as strong as the assumptions it's built on. Document every calculation and cite every source so you can defend your numbers under pressure.
The Bottom-Up Approach This is often more convincing because it’s built from the ground up using tangible business data. You start with the number of potential customers and multiply it by the average revenue you expect from each. For a B2B SaaS product, the formula looks something like this:
(Number of target companies) x (Average number of user seats per company) x (Annual price per seat) = TAM
This method forces you to think deeply about your actual customer segments and pricing strategy, leading to a much more grounded and realistic market size.
Finding Credible Data and Forecasting Growth
The credibility of your entire analysis hinges on the quality of your data. While expensive industry reports are one path, you don't always have to break the bank.
Here are a few places I always look first:
- Government Statistics: Agencies often publish detailed economic data that is both free and reliable.
- Public Company Filings: The annual reports (10-Ks) of public competitors are a goldmine of market insights.
- Industry Associations: These groups frequently release market summaries and trend reports for their members and the public.
The global market research industry itself is booming, with a forecasted 37.25% increase from $102 billion in recent years. Online and mobile quantitative research services alone account for 35% of worldwide revenues. This just shows how much data is becoming available. You can explore more market research statistics to find reliable sources for your own analysis.
Finally, a static market size is useful, but a forward-looking forecast is powerful. Analyze historical trends and industry projections to estimate the Compound Annual Growth Rate (CAGR) for your market. Showing you're targeting a growing market is far more compelling than simply presenting a large but stagnant one. Trust me, that growth forecast is often the most scrutinized piece of the entire analysis.
Gathering Actionable Market Intelligence

Once you’ve scoped your project and built a defensible market size model, it's time to gather the raw materials. This isn’t a dragnet for every stat you can find. It's a targeted hunt for high-quality intelligence that directly addresses the questions you defined at the start.
This process always comes down to a blend of two distinct but complementary approaches: primary and secondary research. One tells you why things are happening on the ground, while the other tells you what is happening at a macro level. Getting this balance right is the key to building a complete and credible picture of your market.
Primary Research: Uncovering Original Insights
Primary research is all about generating new data, straight from the source. You're creating proprietary information tailored to your specific questions—insights you simply can't find on a shelf. Think of it as having direct conversations with your market.
Sure, it can be more time-consuming and expensive, but the depth and relevance of the findings are often worth the investment.
The most common methods include:
- Surveys: Great for gathering quantitative data from a large sample. Use them to validate assumptions about customer preferences, price sensitivity, or brand awareness.
- Interviews: Perfect for deep qualitative dives. One-on-one chats with potential customers or industry experts can uncover the nuanced pain points and motivations that surveys just can't capture.
- Focus Groups: Best for observing group dynamics and testing concepts. Listening to potential customers discuss a product among themselves reveals shared attitudes and social pressures.
Your goal with primary research isn’t just to confirm what you already think. It's to be surprised. The most valuable insights often come from answers you didn't expect, challenging your initial assumptions and revealing hidden opportunities.
Secondary Research: Building on Existing Knowledge
Secondary research is where you analyze information that others have already collected. This is your foundation. It provides the broad context, industry benchmarks, and macroeconomic trends that frame everything else. It’s also much faster and more cost-effective, which is why it’s the logical starting point for any analysis.
The trick is being ruthlessly selective about your sources. Not all data is created equal.
Focus your energy on credible, unbiased sources:
- Government Agencies: Places like the Bureau of Labor Statistics or the Census Bureau are goldmines of reliable demographic and economic data.
- Industry Reports: Reputable firms like Gartner, Forrester, and specialized trade associations publish in-depth market analyses you can lean on.
- Public Company Filings: The annual (10-K) and quarterly (10-Q) reports of public competitors offer incredibly detailed financial data and strategic commentary.
For example, you might find a government statistic showing a 3.8% decline in transportation and warehousing jobs in California since January. That single data point gives you a specific thread to pull on, prompting you to dig deeper with more targeted primary research to find out why it's happening.
Choosing Your Research Methods
Deciding where to invest your time and budget—primary versus secondary—is a critical step. Each approach has its place, and the best analyses almost always use a combination of both. This table breaks down the most common methods to help you choose the right tool for the job.
| Method | Type | Best For | Pros | Cons |
|---|---|---|---|---|
| Surveys | Primary | Gathering quantitative data at scale, validating hypotheses. | Statistically significant results, easy to analyze. | Lacks qualitative depth; can have low response rates. |
| Interviews | Primary | Deep qualitative understanding of motivations and pain points. | Rich, nuanced insights; flexible format. | Time-consuming; small sample size, not scalable. |
| Focus Groups | Primary | Observing group dynamics, testing concepts and messaging. | Reveals social influences; sparks new ideas. | Groupthink can occur; expensive to conduct. |
| Industry Reports | Secondary | Understanding market size, trends, and competitive landscape. | Comprehensive data; saves time and resources. | Can be costly; may not be specific enough. |
| Govt. Data | Secondary | Finding reliable demographic, economic, and trade data. | Highly credible and often free. | Data can be broad and may lag current events. |
| Company Filings | Secondary | Benchmarking against public competitors, financial analysis. | Detailed and verified information. | Only available for public companies; backward-looking. |
Ultimately, secondary research tells you the "what" and "how much," while primary research uncovers the "why." You need both to build a complete narrative.
Bringing It All Together
The real magic happens during synthesis. This is where you weave together the quantitative "what" from secondary sources with the qualitative "why" from your primary findings. When you can connect a broad market trend from a Gartner report to a specific customer pain point you heard in an interview, you’ve got a powerful, defensible insight.
This blended approach is what turns a collection of facts into a strategic narrative that can guide a business with confidence. It’s also where new tools are making a difference. As businesses demand faster answers, AI-powered intelligence is becoming standard. In fact, 69% of researchers now use synthetic data to sharpen their models. You can read more about the future of market research on sganalytics.com to see where the industry is heading.
Benchmarking Your Competitive Landscape
A market analysis without a hard look at the competition is like a map showing only your location—you have no context for the journey ahead. Getting a real handle on your rivals is the only way to carve out a space you can own. This isn't just about listing out their names; it's about systematically breaking down their performance, strategies, and how the market sees them so you can find your unique angle.
The entire point is to build a clear, evidence-based picture of who you’re really up against. It helps you anticipate their next move, find the chinks in their armor, and double down on what you do best. Without this clarity, you're just guessing.

Uncovering Who You're Really Competing With
This first step is often the most revealing. Too many businesses fixate on their most obvious rivals and completely miss the real threats hiding in plain sight. A proper competitive deep-dive means mapping out three distinct types of competitors.
- Direct Competitors: These are the ones offering a nearly identical product or service to the same people you are. Think of the other specialty coffee shop right down the street.
- Indirect Competitors: They solve the same basic problem for your customer, just with a different solution. For that coffee shop, this could be a high-end tea house or a trendy cafe specializing in energy drinks.
- Emerging Competitors: These are the new kids on the block or adjacent players who could easily pivot into your market. This might be a popular local bakery that starts making noise about adding a full-service espresso bar—a clear future threat.
Ignoring those last two categories is a classic, and often costly, mistake. It’s how you get blindsided by disruption from an angle you never saw coming.
How to Build a Solid Benchmarking Framework
Once you know who to watch, the real work begins. A simple list of names gets you nowhere. You need a structured way to compare them across metrics that actually matter. This framework, often called a competitive matrix, is what turns a pile of data into genuine strategic insight.
Your matrix needs to dig deeper than surface-level details like a slick website or a large social media following. You have to focus on the core business drivers that signal real market strength and strategic intent.
A great competitive analysis isn't about proving you're better. It's about objectively finding the gaps in the market that your unique strengths are perfectly suited to fill.
Here are the key things you should be tracking for every competitor:
- Financial Performance: What's their estimated annual revenue? What’s their 5-year Compound Annual Growth Rate (CAGR)? Are they profitable, and what do their net margins look like?
- Product Offering: What are the standout features of their main product? Where does it shine, and where does it fall flat? How do they price it?
- Go-to-Market Strategy: What are their main sales and distribution channels? How do they bring in new leads? What's the core message they're pushing in their marketing?
- Customer Sentiment: What are customers saying in reviews? What are their biggest complaints and praises? How is their brand perceived in the industry?
Where to Find Quality Competitive Intelligence
Sourcing reliable data for this, especially for private companies, takes some real detective work. But there’s a surprising amount of information out there if you just know where to dig.
Public companies are an open book; their annual reports (10-Ks) and investor decks are treasure troves of financial and strategic details. For private companies, you’ll have to connect the dots from a few different places:
- Industry Reports: Market research firms are your best friend here, often providing solid revenue estimates and market share data.
- Press Releases & News Articles: These can give you valuable clues about product launches, recent funding rounds, and key partnerships.
- Customer Reviews & Forums: Sites like G2, Capterra, or even specific subreddits offer unfiltered feedback on product gaps and customer service headaches.
Just look at the market research industry itself as an example. In the United States, it recently hit an estimated $36.4 billion in revenue, growing at a 3.8% CAGR over the past five years. With over 45,000 businesses in the ring, it's a crowded space. You can discover more insights about the U.S. market research sector on IBISWorld to see how this kind of high-level data can frame the competitive intensity you might be facing.
Visualizing Your Place in the Market
With all your data gathered, the final move is to pull it all together into a visual format that tells a story at a glance. The competitive matrix is the perfect tool for this, allowing anyone to immediately see how the key players stack up and where your business fits into the picture.
To make this tangible, a simple competitive matrix helps translate raw numbers into a clear strategic picture. The goal is to see strengths, weaknesses, and opportunities jump off the page.
Sample Competitive Benchmarking Matrix
| Competitor | Annual Revenue | 5-Year CAGR | Net Margin % | Key Product Strength | Primary Go-to-Market Channel |
|---|---|---|---|---|---|
| Company A | $150M | 12% | 18% | Enterprise-grade security | Direct Sales Force |
| Company B | $45M | 25% | 8% | Ease of use for SMBs | Product-Led Growth |
| Company C | $20M | 7% | 22% | Niche feature set | Channel Partnerships |
| Your Company | $5M (proj.) | N/A | -5% (proj.) | Superior integration APIs | Content Marketing |
This kind of table immediately sparks strategic questions. Company B, for instance, is growing like a weed but has razor-thin margins, suggesting they're competing hard on price. Company C is highly profitable but barely growing, hinting at a stable but perhaps complacent player in a niche you could disrupt.
This is exactly how benchmarking evolves from a data-gathering exercise into an actionable strategy that informs your own path forward.
Turning Your Analysis Into a Compelling Strategy
All the data in the world doesn't mean a thing if it doesn't lead to a clear decision. This final phase is where the real value is created. It's the moment you transition from a data collector to a strategic advisor, translating your spreadsheets and findings into a coherent story that forces action.
Your stakeholders—whether they're investors, executives, or product leaders—are not looking for a data dump. They need a clear, confident recommendation on what to do next, backed by the evidence you’ve so carefully gathered.
Crafting the Executive Summary
Let's be honest: your executive summary is probably the only part a busy executive will read. It has to stand on its own and deliver the punchline immediately.
So, start with the conclusion. Lead with your primary recommendation and the single most powerful insight that supports it. A great executive summary answers the "so what?" of your entire analysis in the first few sentences, giving them the bottom line right away.
This isn't just a recap of your activities; it’s a synthesis of your insights. It must crisply answer the core business question you set out to explore, providing a bird's-eye view of the market opportunity, the competitive threats, and the strategic path forward.
Building a Persuasive Narrative
The best market analysis reports I've seen read like a story, not an encyclopedia. Each section should logically build on the last, guiding your audience from the big-picture market context all the way down to your specific, actionable conclusions. A strong narrative makes complex information easy to digest and your argument far more compelling.
Think of the flow like this:
- The Opportunity: Kick things off by restating the market size and growth forecast (your TAM/SAM/SOM). This frames the scale of the prize.
- The Landscape: Next, introduce the key players and market dynamics. Who’s already there, and what forces are shaping the industry?
- The Gap: Here's the climax of your story. Use your competitive benchmarks and customer insights to pinpoint the unmet need or underserved segment you've uncovered.
- The Solution: End with your strategic recommendation. Show exactly how your proposed action—a new product, entering a new market, an acquisition—is the logical answer to the gap you've just proven exists.
This structure transforms a pile of facts into a compelling business case that anyone can follow, understand, and get behind.
The goal isn't just to present data; it's to build conviction. Your final report should leave no doubt about the recommended course of action and why it's the right move, right now.
Designing Slide-Ready Deliverables
In most organizations, your analysis will end up in a slide deck. Anticipating this from the start will save you a ton of time and make your work more impactful. Design every chart, table, and data point as if it's destined for a PowerPoint slide.
Focus on one thing: visual clarity. Use charts for trends, tables for comparisons, and call-out boxes to spotlight key stats. A great slide makes a single, powerful point. If you find yourself trying to explain three different things on one slide, you really need three separate slides.
For a serious head start, tools like StatsHub.ai are designed for this exact workflow. They generate structured, slide-ready reports that already include key visuals like competitive benchmarking tables and market growth charts. This frees you up to spend less time wrestling with formatting and more time honing your story and preparing for the tough questions you know are coming.
Answering Your Lingering Questions About Market Analysis
Even with a solid plan, diving into market analysis can feel a bit like heading into uncharted territory. You're bound to have questions pop up along the way, from "How long is this really going to take?" to "What's the one mistake I absolutely can't afford to make?"
Let's clear the air and tackle some of the most common questions I hear. Think of this as a quick-reference guide to help you sidestep common roadblocks and keep your analysis on the right track.
How Long Does a Proper Market Analysis Take?
This is always the first question, and the honest answer used to be a frustrating "it depends." Today, the answer is a lot more empowering. The timeline really just boils down to the weight of the decision you're making.
If you're weighing a multi-million dollar acquisition or planning a major global expansion, you’re in for a deep dive. Expect this to take several weeks, maybe even a few months, of focused work. You'll be doing serious primary research, building out complex data models, and going through multiple rounds of stakeholder reviews. There's no shortcut for that level of strategic analysis.
But what about the other 99% of decisions? For a quick opportunity assessment, an initial pass on a new feature, or just a sanity check before a planning session, you don’t have weeks. You have hours. This is where modern tools have completely changed the game. You can now generate a structured, data-rich report in minutes, allowing you to get a robust first-pass analysis done in less than an hour.
What Are the Most Common Mistakes to Avoid?
I’ve seen a lot of analyses over the years, and a few classic mistakes pop up time and time again. Knowing what not to do is often just as valuable as having a perfect roadmap.
Keep an eye out for these pitfalls:
- A Fuzzy Scope: If you start without a crystal-clear business question, you’ll end up with a pile of data that doesn't lead to a decision. It's the fast track to a useless report.
- Confirmation Bias: We all do it. We have an idea we love, so we subconsciously look for data that proves us right and ignore anything that suggests we're wrong. Be brutally honest with yourself.
- The Single-Source Trap: Never, ever bet the farm on a single report or dataset. It could be outdated, biased, or just plain wrong. Always find a second or third source to validate your findings.
- Confusing TAM with Your Target: Nothing will sink your credibility faster than showing investors a massive Total Addressable Market (TAM) and calling it your sales forecast. Be realistic.
- The "Data Dump": Your final deliverable isn't just a collection of charts. It's a story. Your job is to connect the dots and provide clear recommendations, not just hand over a spreadsheet.
The most dangerous mistake of all? Writing a report that tells stakeholders what they want to hear instead of what they need to know. Your role is to be the objective truth-teller, even when the truth is uncomfortable.
How Can I Conduct Market Analysis on a Tight Budget?
Let's be real—most of us don't have an unlimited budget. For startups and smaller teams, resourcefulness is the name of the game. The great news is that a lean budget doesn't mean your analysis has to be weak. It just means you have to be smarter about where you look.
Start by milking every free, high-quality secondary source you can find. Government agencies like the Census Bureau, public company 10-K filings, and reports from industry associations are gold mines of free information.
When it comes to primary research, get scrappy. Use free tools like Google Forms to build surveys and then share them in relevant LinkedIn groups, online forums, or through your own network. But the biggest budget-saver is always your time. Instead of burning days piecing together data from a dozen sources, an affordable, on-demand service can give you a comprehensive report for less than the cost of a single subscription.
How Often Should Our Market Analysis Be Updated?
A market analysis isn't a trophy you put on a shelf to gather dust. The market is a living, breathing thing, and your understanding of it needs to be just as dynamic. The right cadence for updates really depends on how fast your industry moves.
In rapidly changing sectors like tech, e-commerce, or consumer apps, you should be doing a high-level review every quarter and a full deep-dive analysis once a year. For more stable and mature industries, a thorough annual review is probably enough.
That said, some events should trigger an immediate refresh, no matter where you are in your cycle. A major new competitor, a disruptive technology, or a sudden shift in the economy or customer behavior are all red flags. The goal is simple: make sure your big strategic bets are always based on a fresh, accurate picture of the world around you.
Ready to get fast, credible answers to your market questions? With StatsHub.ai, you can generate a comprehensive, slide-ready market analysis report in minutes for just $15. Move from question to confident decision in under an hour. Get your instant market report now.
Ready to move faster?
Generate a market report in minutes, not weeks.
$49, easy to share, and ready for your team.