Build a Total Addressable Market Calculator From Scratch
Learn to build a total addressable market calculator with our guide on top-down vs. bottom-up methods, data sources, and creating slide-ready TAM analysis.

A total addressable market calculator isn't just another spreadsheet; it's a strategic tool that puts a number on the entire revenue opportunity out there for your product or service. This calculation is all about answering one fundamental question: what's the absolute maximum growth potential in our chosen market?
Why Mastering Your TAM Is a Non-Negotiable Skill
Before we even think about building a calculator or getting lost in spreadsheets, we need to be crystal clear on why this number matters so much. Your Total Addressable Market (TAM) is far more than an impressive figure to flash in a pitch deck—it's the data point that defines your company's growth ceiling. A well-researched TAM turns market sizing from a theoretical exercise into a powerful strategic asset.
Think of it as the north star for your most critical business decisions. Without a firm grasp on your market's total potential, you're essentially flying blind.

From Vague Guesswork to Strategic Direction
Let's be honest, a vague, aspirational number does more harm than good. It signals a lack of research and can seriously undermine your credibility with investors, board members, and even your own team. A defensible, data-backed TAM, on the other hand, builds immense confidence and provides a clear, actionable direction.
Its impact ripples through the entire organization:
Product Development: It helps you prioritize features that will resonate with the largest possible customer segments.
Marketing Budgets: It justifies resource allocation by clearly showing the potential return on your marketing spend.
Go-to-Market Strategy: It points you toward the channels and regions that offer the biggest bang for your buck.
Investor Relations: It validates your vision with a concrete, quantifiable opportunity that stakeholders can actually get excited about.
Especially in the startup world, TAM has become a make-or-break metric for fundraising. The numbers back this up: startups presenting a TAM over $1 billion raise 3.5 times more funding on average because investors are hunting for truly scalable opportunities. The problem? Miscalculations are rampant. Around 40% of pitches feature inflated figures, often stemming from overly optimistic, back-of-the-napkin math. You can get more great insights into market sizing for fundraising from the experts at WallStreetPrep.
A credible TAM doesn't just show investors how big your pond is; it demonstrates you have the strategic discipline to identify the most fertile fishing spots within it. It's the difference between saying "the market is huge" and proving "here is our specific, billion-dollar opportunity."
Ultimately, getting your TAM calculation right is one of the most valuable skills for any founder, analyst, or strategist. It forces you to dig deep and truly understand your market landscape, your ideal customer, and the real economic potential of your business. This foundational knowledge is what separates high-growth companies from those that never quite get off the ground.
Choosing Your Approach: Top-Down vs. Bottom-Up
Picking the right method to calculate your TAM is probably the most critical decision you'll make in this entire process. It’s not just about a formula; it’s about the story you tell and the credibility you build. The path you take—starting from a 30,000-foot view or building brick by brick from the ground up—will define the strategic value of your final number.
Let's dig into the two classic methods: top-down and bottom-up.
The Top-Down Method: The Telescope View
Think of the top-down approach as looking at your market through a telescope. You start with a massive, all-encompassing market size figure, the kind you’d find in reports from big industry analysts like Gartner, Forrester, or Statista. This is the entire universe of potential spending in a given sector.
From there, your job is to methodically slice away the parts of that universe that don't apply to you. You apply logical filters and constraints that zero in on your specific business focus.
Let’s run a real-world scenario. Imagine you're launching a new B2B project management SaaS specifically for the US construction industry. A top-down calculation might begin with a report stating the global construction software market is a $10 billion pie.
Now, we start carving:
Geographic Filter: First, you’d isolate the U.S. share of that market. Let's say that’s 40%, bringing our number down to $4 billion.
Segment Filter: Next, you need to cut out irrelevant software categories. Your tool is for project management, not accounting or HR, so you'd find the percentage that represents (e.g., 25%), which shrinks the market to $1 billion.
Customer Filter: Finally, if your product is built for small to medium-sized businesses (SMBs), you have to remove the enterprise-level spend. If SMBs represent 60% of this segment, you land on a TAM of $600 million.
This method is quick, which is great for getting a fast sense of scale, especially when you're exploring new markets where detailed data is hard to come by. The catch? It hinges entirely on the quality of third-party data and the logic behind your assumptions. If your filters are based on flimsy guesswork, you can easily end up with an inflated, indefensible number.
The real art here is making sure every filter you apply is backed by solid reasoning. Stakeholders will absolutely poke holes in your assumptions if you can’t defend them.
The Bottom-Up Method: A Granular Reality Check
The bottom-up approach, on the other hand, is like using a microscope. Instead of starting big and whittling down, you begin with the smallest unit: a single potential customer. You build your market size from there. For this reason, it's almost always the more credible method.
It’s about identifying your Ideal Customer Profile (ICP), figuring out how many of them exist in the world, and multiplying that by how much you could realistically earn from each one.
The formula is beautifully simple:
TAM = (Total Number of Potential Customers) x (Average Annual Revenue Per Customer)
Let's stick with our construction SaaS example. A bottom-up approach would look completely different:
Count Your Customers: You'd tap into databases like the U.S. Census Bureau or industry-specific directories to find the actual number of construction firms in the U.S. that fit your SMB criteria (e.g., 5-100 employees). Let's say your research shows there are 400,000 of these companies.
Price Your Product: You determine a realistic average annual contract value (ACV) for your software, which you’ve priced at $1,500.
Do the Math: Multiply the number of companies by your ACV: 400,000 companies x $1,500/year = $600 million.
See the difference? This approach grounds your TAM in the tangible reality of your sales model and your target audience. The resulting figure is often more conservative, but it's far more defensible because it’s built on specific, verifiable data points—not broad industry guesstimates.
This is exactly how a platform like StatsHub.ai works. It digs into specific company data to generate its reports, giving you that granular, bottom-up perspective in a fraction of the time.
This dashboard from StatsHub.ai shows how a market can be broken down into concrete, quantifiable segments for analysis.
A bottom-up analysis forces a reality check. It ensures your big-picture vision is tied directly to the customers you can actually sell to and the money they’re willing to spend.
Finding Data for Your Calculations
Finding the right inputs is half the battle. Whether you're segmenting a huge market or counting individual companies, you'll need reliable data. Here’s a breakdown of common sources and where they fit best.
Data Sources for TAM Calculation
Data Source Type | Examples | Best for Method |
|---|---|---|
Industry Analyst Reports | Gartner, Forrester, IDC, Statista, MarketResearch.com | Top-Down |
Government Databases | U.S. Census Bureau, Bureau of Labor Statistics, Eurostat | Bottom-Up |
Company Databases | ZoomInfo, LinkedIn Sales Navigator, Crunchbase, D&B Hoovers | Bottom-Up |
Public Company Filings | SEC Filings (10-K, 10-Q), Annual Reports, Investor Presentations | Both |
Industry & Trade Associations | National Retail Federation, American Medical Association | Both |
Market Intelligence Platforms | StatsHub.ai, PitchBook, CB Insights | Both |
Ultimately, a mix of these sources will give you the most complete picture, allowing you to cross-reference your findings and strengthen your assumptions.
Why a Hybrid Approach Is the Gold Standard
So, which method wins? The honest answer is neither. The most sophisticated and convincing TAM analyses I've seen always use a hybrid approach.
You run a bottom-up calculation to build a credible, grounded number. Then, you use a top-down analysis as a high-level check to validate it and provide broader market context.
If your bottom-up calculation gives you a $600 million TAM and your top-down analysis lands in the same ballpark, you've just built a highly defensible and compelling case. A huge gap between the two is a red flag—it means one of your core assumptions is probably wrong and needs another look.
This dual-methodology approach shows you’ve done your homework and provides a powerful sanity check. Precision matters. Leading data providers like ZoomInfo build their own market intelligence on verifiable data for a reason—to avoid the massive inaccuracies of purely top-down estimates. In fact, a Forrester study found that top-down estimates can overstate a B2B market by as much as 30%.
As the demand for accuracy grows, so does the growing market for calculation tools that can handle this complexity. That's why the best total addressable market calculator almost always integrates multiple data sources and methods.
Building Your TAM Calculator in Excel or Google Sheets
Knowing the theory is one thing, but the real value comes from rolling up your sleeves and building a dynamic tool you can actually use. Let's walk through how to create a practical total addressable market calculator from the ground up in Excel or Google Sheets. This isn't just about getting a single number; it's about building a reusable model that flexes as your assumptions and data evolve.
A well-structured calculator is your best friend for building clarity and confidence in your numbers. I've found that the best way to keep things clean and easy to follow is to organize the spreadsheet into three distinct tabs.
Setting Up Your Calculator for Success
A messy spreadsheet is a fast track to costly mistakes. To keep your model transparent, especially when you need to share it with investors or your leadership team, a three-tab structure is non-negotiable. Think of it as the foundation of good financial modeling.
Here’s the setup I always recommend:
Inputs Tab: This is your command center. All of your core assumptions—market growth rates, pricing tiers, customer counts, and penetration rates—should live right here. By centralizing these variables, you can update your entire model in seconds without ever having to hunt through a maze of formulas.
Calculations Tab: This is the engine room. It’s where you do all the heavy lifting—processing the raw data, segmenting customer lists, applying filters, and running the core TAM, SAM, and SOM calculations based on the variables from your Inputs tab.
Summary Dashboard: This is your final, presentation-ready output. It pulls the polished numbers from the Calculations tab and displays them in a clean, easy-to-read format. This is where you'll put your key charts and takeaways.
This disciplined approach does more than just prevent errors; it makes your model auditable and easy for anyone to understand your logic.
The diagram below shows how different calculation methods feed into the logic of your spreadsheet.
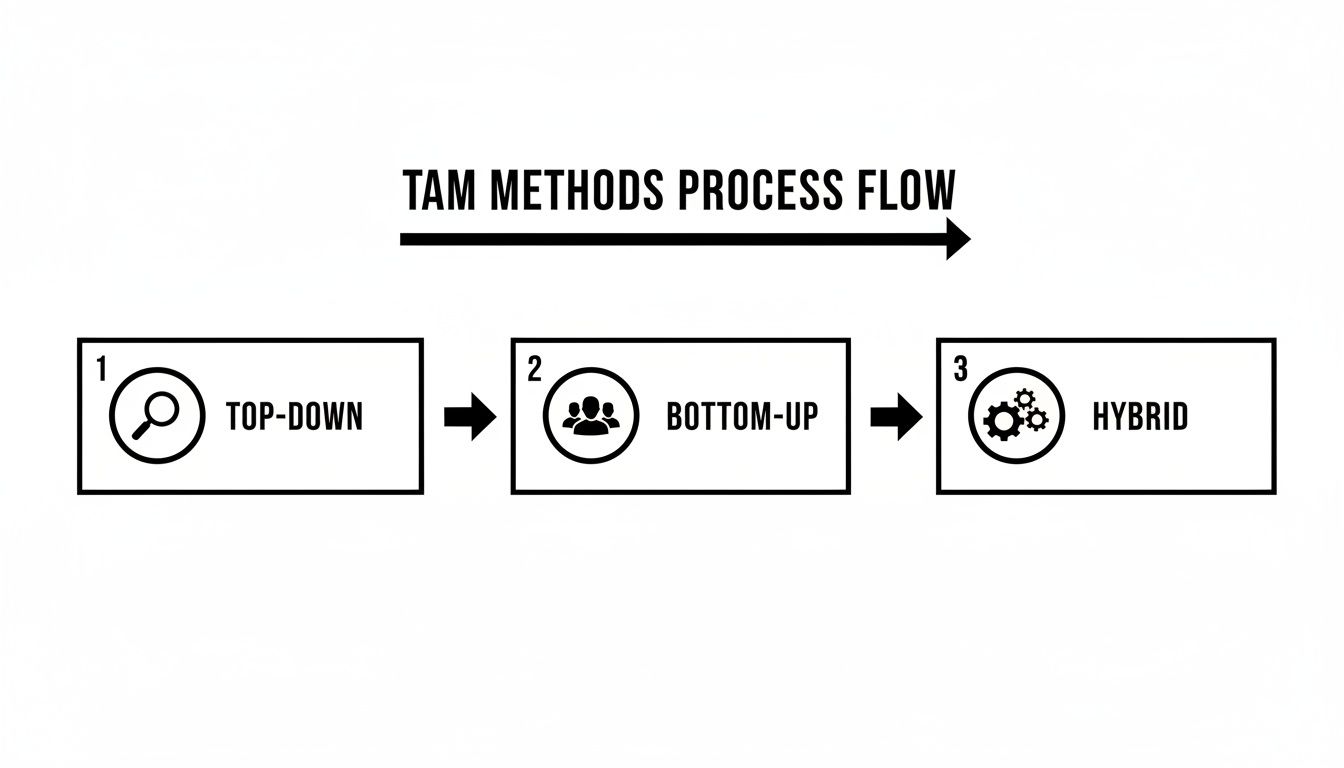
Whether you start broad (Top-Down) or get granular (Bottom-Up), your calculator is the tool that quantifies this process and helps you land on a credible, defensible number.
Essential Formulas for a Dynamic Model
To make your calculator come to life, you only need a handful of powerful spreadsheet functions. These are especially critical when you're working with a large list of potential customers for a bottom-up analysis.
Let's say you've got a raw list of target companies sitting in your Calculations tab.
SUMIF: This is your go-to for segmenting revenue. Have a list of companies with their industry and potential annual contract value (ACV)? Use
=SUMIF(IndustryColumn, "Healthcare", ACV_Column)to instantly calculate the total market value for just the healthcare sector.COUNTIF: Just as useful, this function helps you tally up potential customers within a specific segment. A simple formula like
=COUNTIF(CountryColumn, "USA")tells you exactly how many target accounts are based in the United States.VLOOKUP / XLOOKUP: These functions are absolute workhorses for enriching your data. If you have your main company list and a separate table with industry-specific pricing,
VLOOKUPcan automatically assign the right ACV to each company. It’s a massive time-saver.
The real point here isn't just to calculate a static number. It's to build a model that can answer "what if" questions. A truly dynamic calculator lets you stress-test your assumptions and see which variables swing your market size the most.
Incorporating a Sensitivity Analysis
A single TAM figure, presented in a vacuum, can feel brittle and arbitrary. Smart investors and executives know that your assumptions are just educated guesses. This is where a sensitivity analysis comes in, adding a crucial layer of credibility to your work.
It lets you model best-case, worst-case, and base-case scenarios, showing that you’ve thought through the potential risks and upside.
Building a sensitivity analysis is surprisingly straightforward. You just create a data table where rows represent one key variable (like Average Revenue Per User) and columns represent another (like your market penetration rate).
ARPU / Penetration | 5% | 10% (Base) | 15% |
|---|---|---|---|
$4,000 | $20M | $40M | $60M |
$5,000 (Base) | $25M | $50M | $75M |
$6,000 | $30M | $60M | $90M |
This simple grid instantly reveals how your Serviceable Obtainable Market (SOM) shifts as your core assumptions change. Presenting this shows you have a deep command of the market dynamics and makes your entire analysis more believable. It turns your calculator from a simple tool into a strategic asset for planning and decision-making.
Go Regional for a Smarter Go-to-Market Strategy
A big, global TAM number looks great on a slide, but it's often a vanity metric. It hides the messy, nuanced reality of what it actually takes to win in different parts of the world. A market isn't a single entity; customer needs, what they're willing to pay, and the competitive friction you'll face can be wildly different between the Americas, APAC, and Europe.
If you don't break down your TAM by region, you’re basically flying blind. A massive potential market in a developing region might seem like a goldmine, but it could demand huge investments in product localization, untangling a web of local regulations, and building sales channels from scratch. That’s a completely different ballgame than expanding into a smaller, more mature market where you can hit the ground running with a proven playbook.
Hunting for Local Data
To get this right, you have to move past sweeping global reports and get your hands on data specific to each geography. It’s more legwork, no doubt, but the strategic clarity you gain is worth every minute.
Where do you find this stuff? I usually start here:
National Statistics Bureaus: Think of organizations like the U.S. Census Bureau or Eurostat. They offer incredibly detailed data on company counts, economic output, and demographics that you can't find anywhere else.
Regional Market Research: Find the firms that live and breathe a specific continent or country. Their reports are packed with the kind of on-the-ground insights that global overviews miss.
Public Company Filings: This is a great pro tip. When your big competitors operate globally, their annual reports often slice their revenue by geographic segment. This gives you a fantastic proxy for how the market is actually distributed.
The goal is to find localized inputs for your bottom-up model. For example, instead of a single global Average Contract Value (ACV), you might find your ACV in Europe is 20% higher than in APAC because customers there expect—and will pay for—more robust features. That one adjustment can completely change how you see each market's potential.
A Real-World SaaS Example
Let's walk through a quick scenario. Imagine a B2B SaaS company that sells a project management tool. They've done their homework and calculated a global bottom-up TAM of $500 million. A solid number, but it doesn't tell them where to put their next dollar of investment.
So, they start digging into the regional data:
The Americas: They uncover 150,000 target companies. Based on early customer data and a look at competitor pricing, they land on a conservative ACV of $2,000. That gives them a regional TAM of $300 million.
Europe: Here, they find a smaller pool of 100,000 potential customers. But—and this is key—stricter data privacy rules and a demand for more advanced features mean they can command a higher price of $2,500 ACV. The European TAM is a very healthy $250 million.
APAC: This region has the most potential customers, with 200,000 companies. The catch? The market is extremely price-sensitive. They have to model a much lower ACV of just $750, putting the APAC TAM at $150 million.
All of a sudden, the path forward is much clearer. While the Americas is the biggest prize by total value, Europe is an incredibly strong opportunity because of the high revenue per customer. This kind of insight immediately shapes everything from where they hire their next sales team to which product features get prioritized.
A regional TAM breakdown turns your market sizing from a simple number into a strategic roadmap. It doesn't just tell you how big the opportunity is; it tells you where it is and why, so you can allocate your resources with confidence.
This level of analysis is quickly becoming the standard. The demand for specialized market intelligence is even fueling the growth of the global calculator market itself, which includes tools for building a total addressable market calculator. That market hit $447.18 million and is expected to climb to $635.935 million by 2033, with the Asia Pacific region being a major driver. You can read the full report on the calculator market's impressive growth.
It's why platforms like StatsHub.ai exist. They automate the painful process of sourcing all these different data points and pulling them together into a coherent, actionable report, with regional cuts built right in.
How to Present Your TAM for Maximum Impact
You've done the heavy lifting and built a robust total addressable market calculator. Now comes the critical part: translating those numbers into a story that sticks. A brilliant calculation means nothing if it doesn't land with your audience, whether you're in a high-stakes investor pitch or a quarterly board meeting.
The goal isn't just to present a number; it's to build a case. You need to walk your stakeholders through your logic, get them to buy into your assumptions, and ultimately, believe in the strategic vision your TAM represents.

Building the Perfect TAM Slide
When it comes to your presentation slide, less is more. A busy, cluttered slide is the fastest way to lose your audience. A clean, visually intuitive slide should anchor your narrative, not distract from it.
Every great TAM slide needs three things:
A Clear Visual Metaphor: The classic onion diagram (the concentric circles) is popular for a good reason—it’s instantly understandable. It neatly shows the relationship between your broad TAM, the more focused SAM, and your immediate target, the SOM.
The Big Numbers, Front and Center: Don’t make people squint. Display the dollar values for TAM, SAM, and SOM clearly. These are the main takeaways, so make them impossible to miss.
The Key Assumptions: In a small footnote or a discreet sidebar, list the 2-3 most critical assumptions that your entire calculation hinges on. This could be your assumed average contract value (ACV), the total number of target companies, or a key demographic filter.
Including your assumptions right on the slide signals transparency and shows you’ve put real thought into the numbers, which builds instant credibility.
Telling the Story Behind the Numbers
This is where your expertise shines through. Never just read the numbers off the slide. Your job is to narrate the journey of how you got to these figures and, more importantly, what they mean for the business.
As you talk through the slide, make sure to cover these points:
Define Your Approach: Kick things off by clearly stating your methodology. "We took a bottom-up approach to build our market size," is far more compelling than just throwing up a number. A bottom-up analysis is almost always seen as more credible, so if you did one, lead with it.
Defend Your Assumptions: Briefly explain the "why" behind your key inputs. For example, you might say, "We landed on a $5,000 ACV based on data from our first few pilot customers, and it aligns with the pricing of our top three competitors."
Name Your Sources: Bolster your claims by mentioning where your data came from. Citing authoritative sources like "U.S. Census Bureau data" or "recent industry reports from Forrester" shows your analysis is grounded in fact, not fiction.
Tie It All to Strategy: This is the most crucial step. Connect the market size directly to your business plan. Explain how your SOM isn't just a random slice of the market, but a specific, actionable go-to-market strategy for the next 12-18 months.
Your TAM shouldn't feel like some big, abstract number. The goal is to present it as a well-defined opportunity that your team has a clear, realistic plan to go after, starting immediately with your SOM.
Of course, getting from raw data to a polished, presentation-ready slide takes time. This is where tools like StatsHub.ai can make a real difference. They automate the data gathering and generate the slide visuals for you, letting you spend your time perfecting the strategic narrative instead of fighting with spreadsheet formatting. It helps you get from a tough question to a credible answer, fast.
Common TAM Calculation Pitfalls to Avoid
Even the sharpest analysts can stumble when putting together a market sizing model. A flawed calculation isn't just a wrong number—it's a crack in the foundation of your entire strategic narrative, and it’s something that can quickly make investors lose faith. Staying clear of these common mistakes is crucial if you want a TAM that’s not just big, but believable.
The most common trap I see is relying solely on a top-down analysis without ever bothering to validate it from the bottom up. It's tempting to grab a huge market figure from a Gartner or Forrester report and just slice off a percentage for yourself. It feels easy, but it often produces wildly optimistic numbers that fall apart the moment someone asks a tough question.
Without the sanity check of a bottom-up build, your TAM is just a fantasy, completely disconnected from what your sales team can actually achieve.
Confusing Market Potential with Market Reality
Another classic blunder is mixing up the total universe (TAM) with the slice you can realistically go after (your SAM). Claiming your TAM is the entire global industry for anything ignores the very real constraints you face, like geography, regulatory hurdles, sales channels, and whether your product is even a fit for every segment.
This isn't just a numbers mistake; it signals a lack of strategic focus. It tells people you haven't thought critically about where to point your resources.
The textbook cautionary tale here is WeWork’s infamous 2019 IPO attempt. They presented a jaw-dropping $3 trillion TAM by essentially claiming all commercial real estate was their playground. This completely ignored the practical reality of their actual serviceable market. Investors saw right through it, and the disconnect between that fantasy figure and a more realistic $10-20 billion bottom-up market contributed to a staggering 90% drop in valuation. You can read more about how TAM missteps can impact valuations on Cognism.com.
The lesson is simple: smart investors and seasoned executives have a finely-tuned radar for inflated numbers.
Ignoring Data Quality and Competition
Finally, a lot of TAM models are dead on arrival because the inputs are junk. Using old reports, questionable data sources, or pretending competitors don't exist will make your entire analysis worthless.
Watch out for these specific issues:
Stale Data: A market report from three years ago is a historical document, not a reflection of today's economy or customer behavior.
Pretending You’re Alone: Assuming you can just walk in and take a market segment without acknowledging the entrenched competitors already fighting for it is a massive oversight.
Wobbly Assumptions: Every single number in your model, from customer counts to average revenue per user, has to be something you can defend with confidence. "It felt right" doesn't cut it.
At the end of the day, a credible TAM is built on rigor and intellectual honesty. If you sidestep these common pitfalls, you’re not just creating a spreadsheet; you’re building a powerful strategic tool that inspires confidence and guides smart decisions.
Common Questions About Calculating TAM
Even with the best methods and a solid spreadsheet, you're bound to run into some tricky questions when you're in the weeds of building a TAM model. Here are a few of the most common ones I've seen pop up, from early-stage founders to seasoned analysts.
How Often Should I Update My TAM?
Think of your TAM as a living number, not a "set it and forget it" metric. Markets are constantly in flux—new tech emerges, competitors pivot, and economic winds shift. So, how often should you revisit it?
A good rule of thumb is to refresh your TAM analysis annually. However, if you're in a fast-moving industry or a high-growth startup, a quarterly check-in is much smarter. You should also trigger an immediate review if something big happens, like a major competitor going bust or a new regulation opening up a whole new customer base.
What If There's No Market Research for My Niche?
This is a classic problem, especially for companies that are genuinely innovating and creating a new category. Don't panic. The absence of a pre-packaged market report is actually an opportunity.
This is where you have to lean heavily on a bottom-up approach and first principles. Start by identifying proxy markets or adjacent customer behaviors. For instance, if you're building a new type of collaboration software for remote-first creative agencies, you'd start by counting the number of those agencies, the number of potential users within them, and then build your pricing model from there.
The absence of a pre-defined market report isn't a dead end; it's an opportunity to define the market yourself. A well-reasoned, bottom-up model based on tangible customer segments is often more credible than a generic industry report.
Can My TAM Actually Shrink?
Yes, and it's naive to assume it can only go up. A shrinking TAM is a real risk. An economic recession could slash corporate budgets, a competitor could launch a disruptive technology that makes your solution look dated, or new government regulations could suddenly make your product non-compliant in a key region.
This is exactly why you can't just do the analysis once and stick it in a pitch deck forever. Regularly updating your TAM keeps your strategy tethered to reality, not to assumptions you made a year ago.
Ready to skip the spreadsheet headaches and get straight to the insights? StatsHub.ai delivers a comprehensive, slide-ready market analysis with global and regional TAM breakdowns in minutes for just $15. Get your instant report at https://www.statshub.ai.
Ready to move faster?
Generate a market report in minutes, not weeks.
$49, easy to share, and ready for your team.